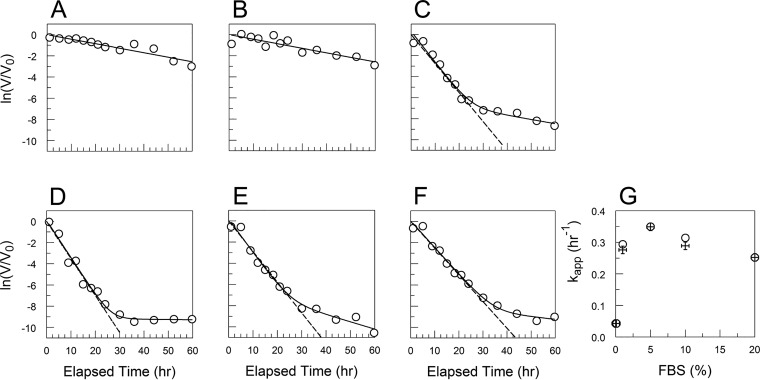
FIG 11.
CVB3/28 decay curves for varied FBS concentrations in PBS. These curves are similar to those previously reported for preparations of CVB3/28 under selection for more-stable variants (27). Viruses with stabilizing mutations exist as minor populations in stocks of CVB3/28 (27). The lines in panels A (no FBS) and B (FBS = 0.1%) were fit by linear regression to all of the data points. (C to F) FBS at 1%, 5%, 10%, and 20%, respectively. The dotted lines were obtained by linear regression using only points where ln(V/V0) is −7 or greater. The solid lines were fit by using nonlinear regression and the equation ln(V/V0) = ln[A · exp(–k1 · t) + (1 – A) · exp(–k2 · t)] + Int, where A is the proportion of CVB3/28 in the population, k1 is the kapp for CVB3/28, k2 is the kapp for the more stable virus population, Int is the y intercept, and t is elapsed time in hours. k1 values are presented in Table 1. The average value for A was 0.999 ± 0.0009. The plot in panel G presents kapp values calculated from the two-population model (circles) and the kapp from linear regression fitted to the truncated data sets (+). The average k2 for panels C through F was 0.034 h−1 (standard deviation [SD] = 0.024 h−1).

