FIG 2.
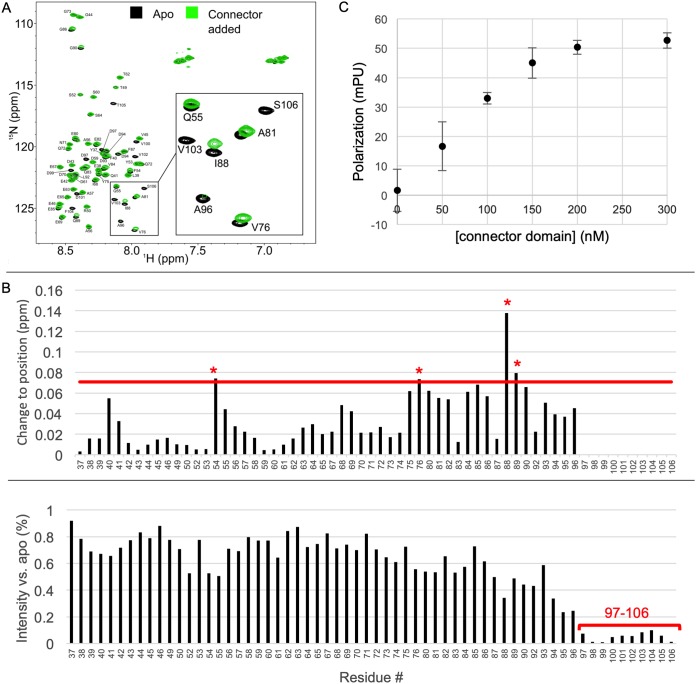
VSV P residues 76 to 106 interact with the VSV L connector domain. (A) HSQC spectra of PNTD, residues 35 to 106, showing amide shift migration and intensity loss upon the addition of the connector domain (apo spectra in black, connector added in green). (B) The changes to position (top) and intensity (bottom) of amide peaks upon connector addition are presented. On the upper graph, a red line is present at our quantitative cutoff (see Materials and Methods) at 0.071 ppm, and residues with significant amide peak migrations are indicated in red asterisks. In the intensity plot, a region of greater than 80% signal depletion is noted in residues 97 to 106 (red bar). Due to difficulty in tracking severely weakened peaks, migrations are not provided for residues 97 to 106. (C) Fluorescence anisotropy using a peptide identical in sequence to VSV P 80 to 106 with an N-terminal FITC label was performed with various concentrations of the connector domain. mPU, millipolarization units.

