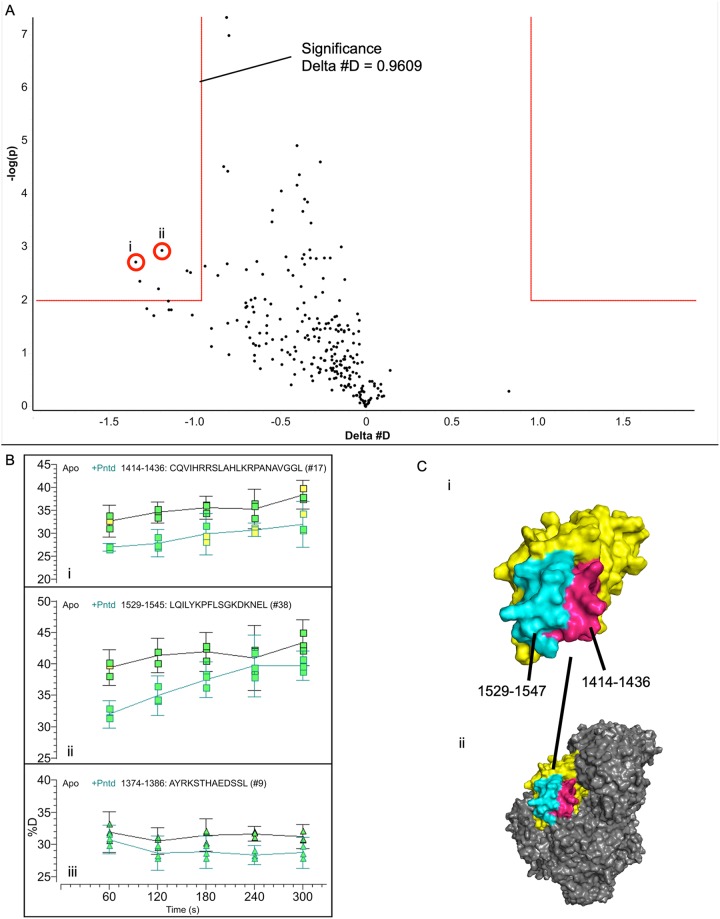
FIG 3.
Hydrogen-deuterium exchange of the connector-P interaction. (A) HDX-MS time course experiments were conducted in the 1- to 5-min range using the connector domain as an analyte and PNTD as a variable. A volcano plot, which quantifies the significance of a change in deuteron uptake against the magnitude of the change for each time point, is shown. The box in the upper left corner contains time points which showed a significant decrease in deuteron uptake of the PNTD sample relative to the apo sample at a confidence of P value of ≤0.01. (B) Representative peptide uptake plots are shown from the HDX-MS time course. Peptides indicated in the volcano plot are displayed (i, ii), as is a representative peptide not indicated as significant (iii). Error bars display 95% confidence intervals for deuteron uptake. (C) i, the connector domain (yellow) is displayed with the significant regions highlighted (1414 to 1436, pink; 1529 to 1547, cyan); ii, the connector is shown in the context of L with other domains shaded in gray. The images of L are based on PDB ID 5A22.

