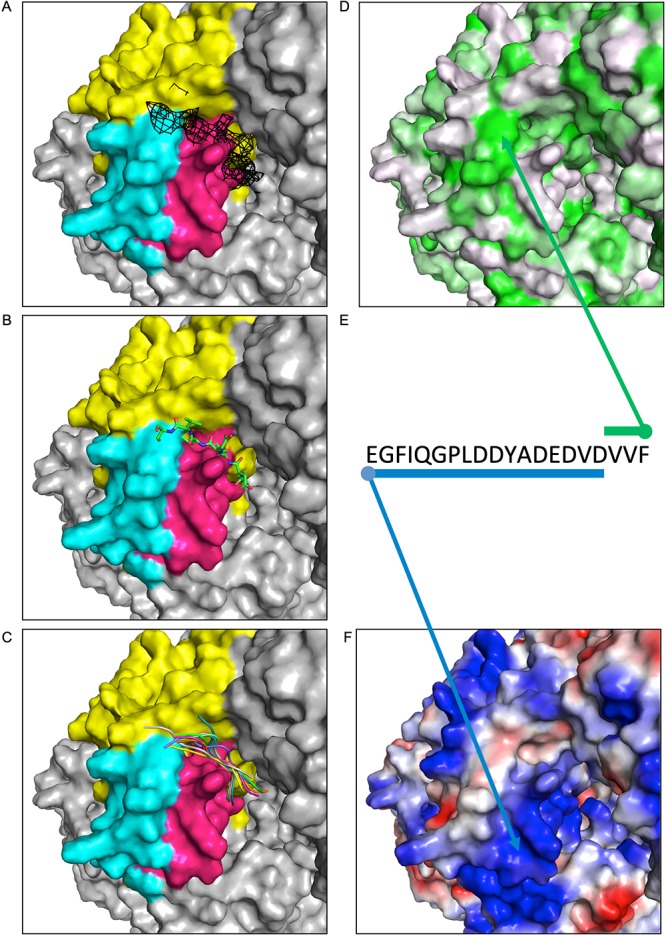
FIG 4.

Docking studies using VSV P and L. A fixed view of the connector domain is provided in each window. (A) The connector domain (yellow) is displayed with residues implicated in P binding by HDX highlighted in pink (1414 to 1436) or cyan (1529 to 1547). Unassigned density from the VSV L reconstruction (11) is shown in black mesh at a contour level of 2σ. (B) Starting model of VSV P 97 to 104 is shown positioned proximal to the density. (C) The top 10 docked models are displayed as cartoons, each in a different color. (D) The surface of L is colored by hydrophobicity using the PyMOL color h script with a normalized consensus hydrophobicity scale (white to green, hydrophilic to hydrophobic). (E) The sequence of the VSV P acidic stretch and VxΩ motif is shown, with arrows and bars indicating suspected interactions of P with hydrophobic (green) or basic (blue) patches of the L protein. (F) The surface of L is displayed by charge using the vacuum electrostatics feature of PyMOL (blue to red, basic to acidic).
