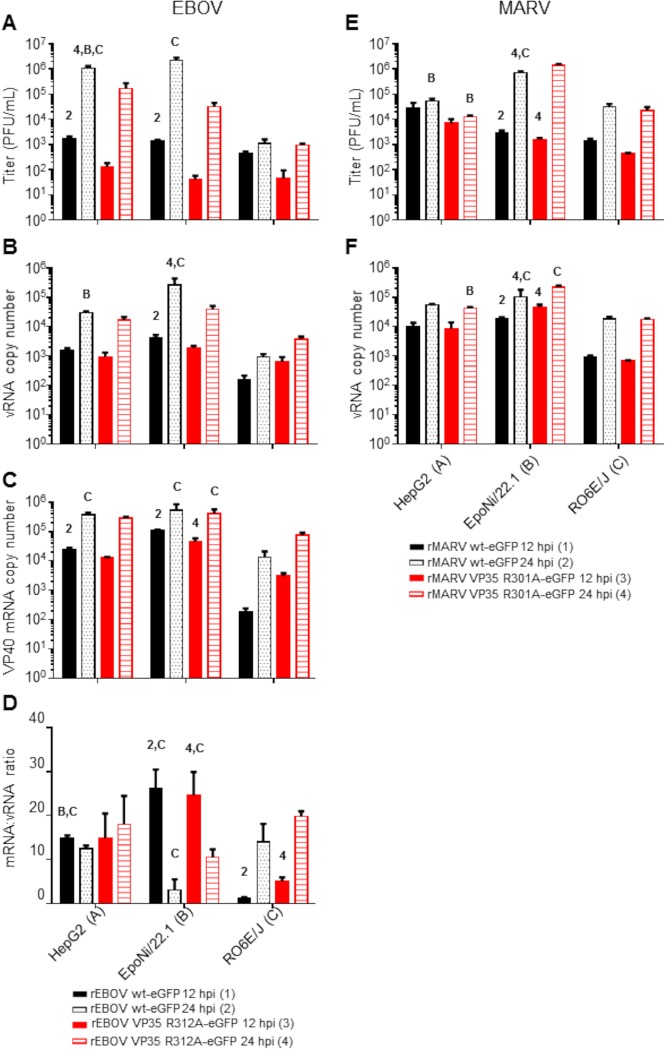
FIG 1.
Viral titers and RNA abundances from human and bat cell lines following infection with EBOV or MARV. (A and E) Supernatants from EBOV (A)- or MARV (E)-infected cells used to make sRNA sequencing libraries were assayed by plaque titration. (B, C, and F) Total RNAs from cell monolayers were assayed by qRT-PCR for the presence of vRNA/cRNA and mRNA for EBOV (B and C) or vRNA/cRNA only for MARV (F). RNA quantities are expressed as copy numbers per nanogram of total RNA. (D) For EBOV, the ratio of mRNA to vRNA was calculated for each virus and time point. For all panels, virus–time point combinations were assigned numbers 1 to 4, and cell lines were assigned letters A to C. Within a cell line, comparisons were made between the 12- and 24-h time points for each virus or between viruses within a time point. Comparisons between cell lines were made for each virus at a given time point. The data plotted represent the means of three biological replicates ± standard deviations. Numbers or letters above bars indicate significant differences from other time points (assigned the corresponding number) or cell lines (assigned the corresponding letter) as measured by two-way analysis of variance (α = 0.05), followed by Tukey’s multiple-comparison posttest. For a comprehensive list of comparisons and P values, refer to Data Set S2 in the supplemental material.

