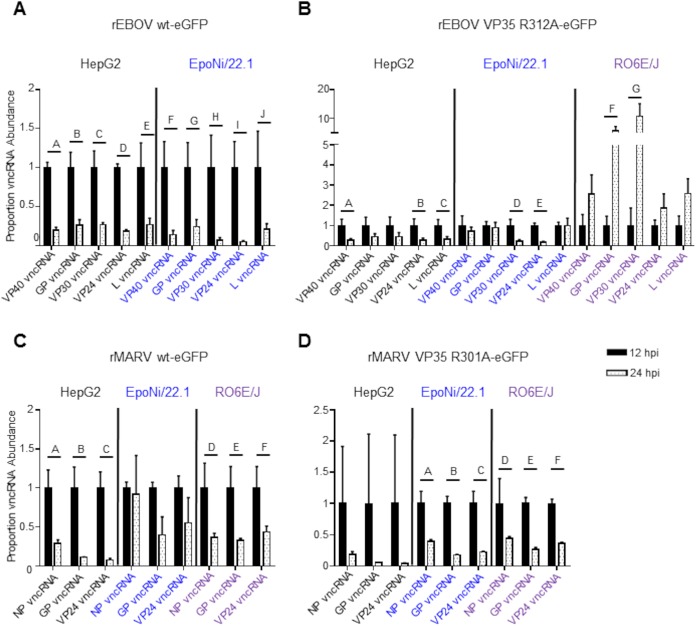
FIG 10.
Filovirus vncRNA abundance changes over time. For each virus, the proportion of each vncRNA relative to vRNA abundance at 24 hpi was compared to the abundance at 12 hpi (set to 1). The normalization procedure is described under “Bioinformatics” in Materials and Methods. All statistical comparisons were made using two-way analysis of variance followed by Sidak’s multiple-comparison posttest. Letters above bars indicate significance as given in the legend to each panel. (A) wt rEBOV–eGFP. A, P ≤ 0.0001; B, P ≤ 0.0001; C, P ≤ 0.0001; D, P ≤ 0.0001; E, P ≤ 0.0001; F, P = 0.0044; G, P = 0.0134; H, P = 0.0022; I, P = 0.0017; J, P = 0.0098. Note that RO6E/J cells were omitted from this analysis. (B) rEBOV VP35 R312A–eGFP. A, P = 0.0175; B, P = 0.0205; C, P = 0.0322; D, P = 0.0065; E, P = 0.0037; F, P=-0.0079; G, P ≤ 0.0001. (C) wt rMARV–eGFP. A, P = 0.0007; B, P ≤ 0.0001; C, P ≤ 0.0001; D, P = 0.0091; E, P = 0.0056; F, P = 0.0182. (D) rMARV VP35 R312A–eGFP. A, P = 0.0002; B, P ≤ 0.0001; C, P ≤ 0.0001; D, P = 0.0054; E, P = 0.0007; F, P = 0.0020. For all panels, the means for three biological replicate sequencing libraries for each group ± standard deviations are plotted.

