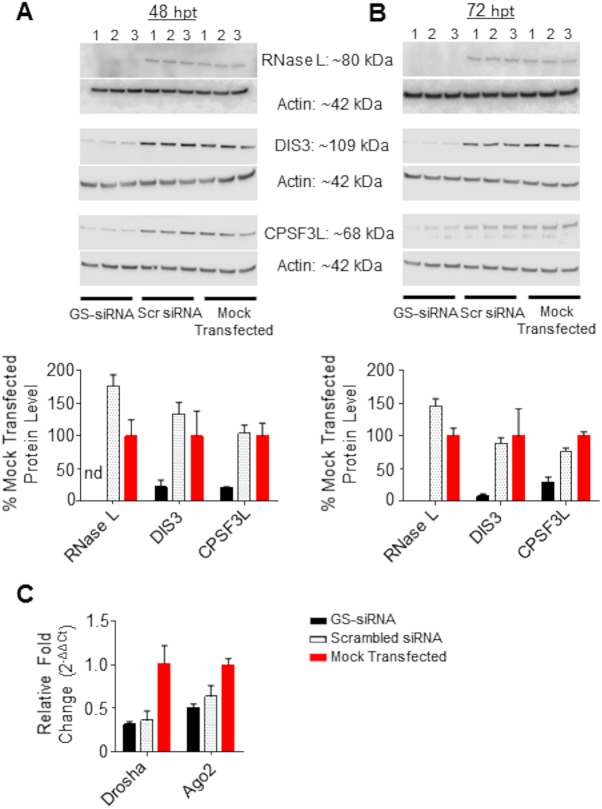
FIG 14.
Validation of siRNA knockdown by Western blotting and qRT-PCR. (A and B) (Top) Western blots and band pixel density analysis of RNase L, DIS3, and CPSF3L in siRNA-transfected cells at 48 h (A) and 72 h (B) posttransfection. For both panels, siRNA knockdowns were performed in triplicate (numbers above the blot images). GS, gene-specific siRNA; Scr, scrambled (nonspecific) siRNA. (Bottom) Quantitative data on the levels of proteins in siRNA-transfected cells, derived from Western blotting and normalized to those for mock-transfected cells. nd, not determined. (C) qRT-PCR of Drosha and Ago2 mRNA transcripts. For all panels, bars represent the means for three biological replicates and error bars represent standard deviations.

