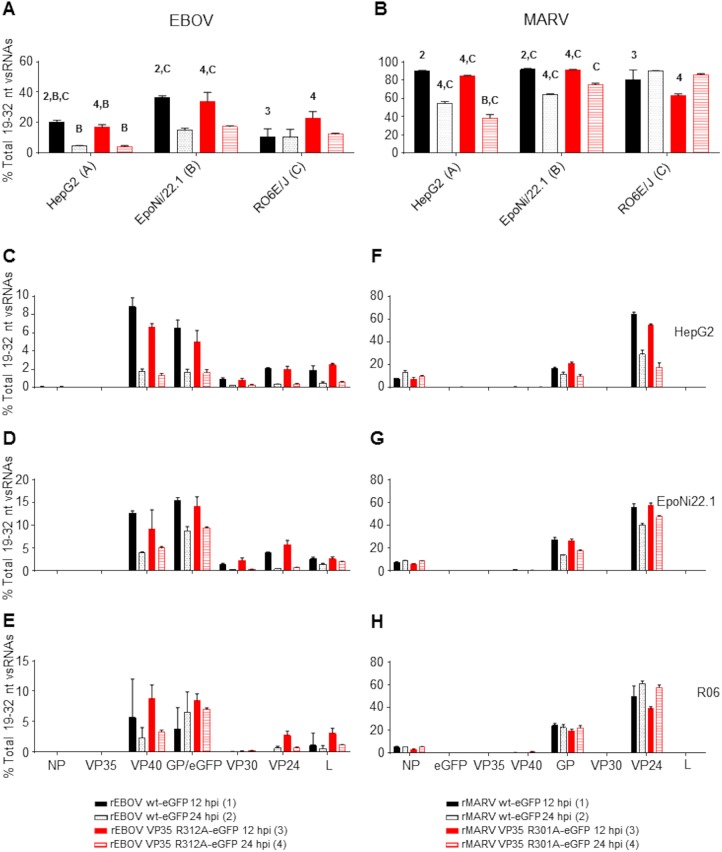
FIG 6.
Filovirus vncRNAs make up a substantial portion of the total vsRNA population. (A) Proportion of combined EBOV VP40, eGFP/GP, VP30, VP24, and L vncRNAs relative to the total vsRNA population in all cell lines. (B) Proportion of combined MARV NP, GP, and VP24 vncRNAs relative to the total vsRNA population in all cell lines. For each virus, time points were assigned numbers, and cell lines were assigned letters. Within a cell line, comparisons were made between the 12- and 24-h time points for each virus or between viruses within a time point. Comparisons between cell lines were made for each virus at a given time point. Numbers or letters above bars indicate significant differences between either time points (assigned the corresponding number) or cell lines (assigned the corresponding letter) as measured by two-way analysis of variance (α = 0.05), followed by Tukey’s multiple-comparison posttest. For a comprehensive list of comparisons and P values, refer to Data Set S2 in the supplemental material. (C to E) Histograms plotting individual proportions of EBOV vncRNAs relative to the total vsRNA population in HepG2 (C), EpoNi/22.1 (D), and RO6E/J (E) cells. (F to H) Histograms plotting individual proportions of MARV vncRNAs relative to the total vsRNA population in HepG2 (F), EpoNi/22.1 (G), and RO6E/J (H) cells. For all panels, the means for three biological replicate sequencing libraries for each group ± standard deviations are plotted.

