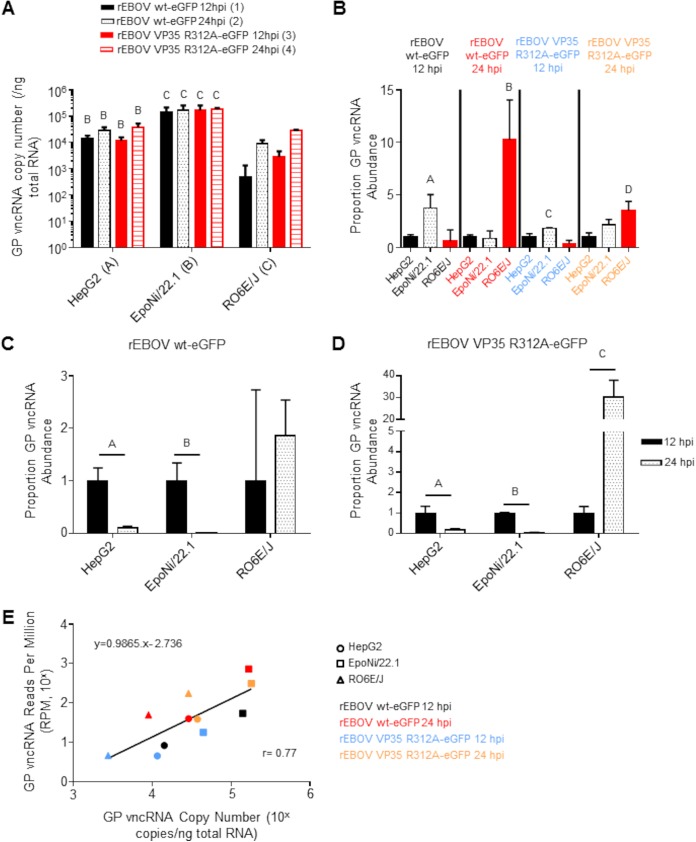
FIG 9.
Absolute quantitation of EBOV GP vncRNA by qRT-PCR. Total RNA from the same samples used to generate the wt rEBOV–eGFP and rEBOV VP35 R312A–eGFP small-RNA sequencing libraries was used for absolute quantitation of the EBOV GP vncRNA using qRT-PCR. (A) EBOV GP vncRNA copy number per nanogram of total RNA. For statistical comparison, time points were assigned numbers and cell lines were assigned letters. Within a cell line, comparisons were made between the 12- and 24-h time points for each virus or between viruses within a time point. Comparisons between cell lines were made for each virus at a given time point. Numbers or letters above bars indicate significant differences between either time points (assigned the corresponding number) or cell lines (assigned the corresponding letter) as measured by two-way analysis of variance (α = 0.05), followed by Tukey’s multiple-comparison posttest. For a comprehensive list of comparisons and P values, refer to Data Set S2 in the supplemental material. (B) For each virus and time point, the abundance of the GP vncRNA relative to the vRNA abundance from EpoNi/22.1 and RO6E/J cells was compared to the abundance in HepG2 cells (which was set to 1). The normalization procedure is described under “Bioinformatics” in Materials and Methods. All statistical comparisons were made against HepG2 cells by using one-way analysis of variance followed by Dunnett’s multiple-comparison posttest. Specific P values, indicated by the letters above the bars, are as follows: A, P = 0.0230; B, P = 0.0039; C, P = 0.0133; D, P = 0.0052. (C and D) For either wt rEBOV–eGFP (C) or rEBOV VP35 R312A–eGFP (D), the proportion of GP vncRNA relative to vRNA abundance at 24 hpi was compared with the abundance at 12 hpi (set to 1). The normalization procedure is described under “Bioinformatics” in Materials and Methods. Statistical significance was computed using independent unpaired t tests (α = 0.05) with the Holm-Sidak correction for multiple comparisons. For panels A to D, the data plotted represent the means for three biological replicates ± standard deviations. (E) The degree of agreement between the methods of RPM normalization and absolute quantitation of the GP vncRNA was assessed by plotting the mean RPM of three biological replicates from each sample group against the mean GP vncRNA copy number (per nanogram of total RNA) from each sample group. The coefficient of correlation was calculated by the Pearson method (P = 0.0054), and a best-fit line was drawn using linear regression.

