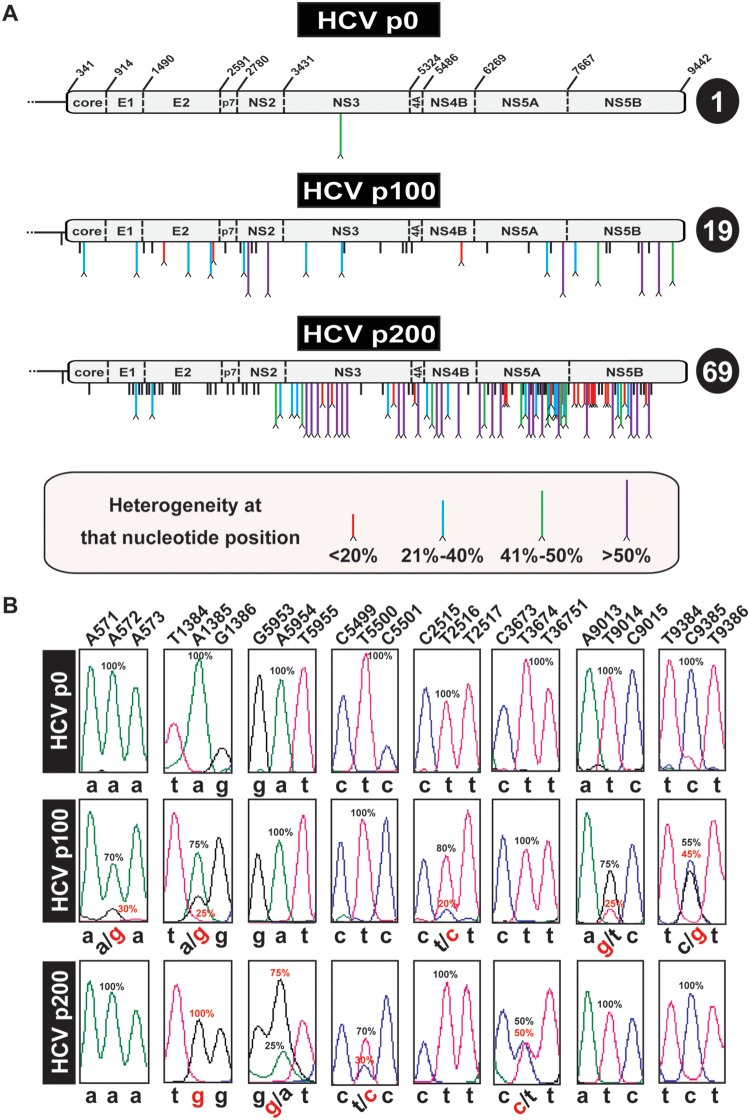
FIG 3.
Heterogeneities in the consensus sequence of HCV p0, HCV p100, and HCV p200. (A) Schematic of the HCV p0, HCV p100, and HCV p200 genomes. In HCV p0, the RNA residue numbers (reference isolate, JFH-1) that delimit the encoded proteins are indicated. Mutations (relative to the HCV sequence in plasmid Jc1FLAG2[p7-nsGluc2A]) are identified by vertical lines below the genome. Mutations at sites with no evidence of heterogeneity are indicated by short black lines. A caret at the tip of a line represents heterogeneity at that nucleotide position (two peaks in the same sequence position). The percentage range (length and color code given in the box at the bottom) indicates the proportion of the mutant in the chromatogram sequence, estimated by triangulation, as explained in Materials and Methods. The total number of heterogeneity points per genome is indicated in the circle at the right of each genome. (B) Examples of nucleotide positions (shown at the top) where heterogeneities have been found. For simplicity, below each panel, the nucleotides are written in lowercase letters; heterogeneities are depicted by two nucleotides separated by a slash. Frequencies (percentage) are written next to the relevant peaks.

