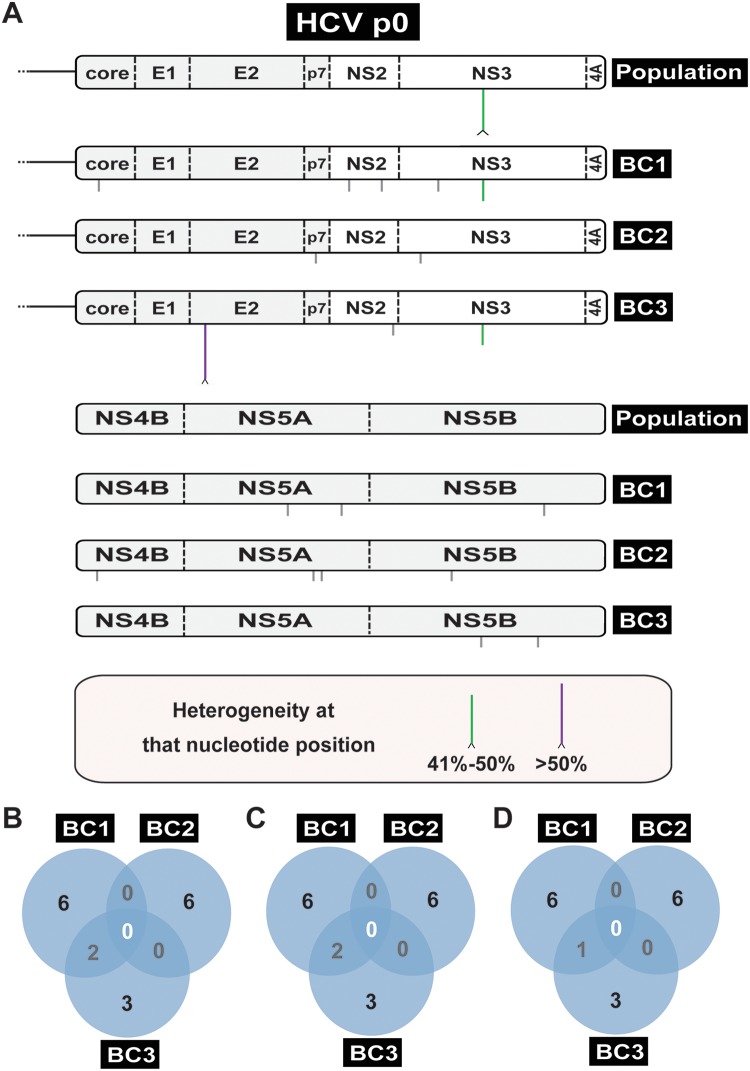
FIG 4.
Consensus genomic sequence of the HCV p0 population and three biological clones isolated from the population. (A) Schematic of the HCV genome divided into two parts, with the genome under study indicated on the right (population is the uncloned HCV p0; BC1, BC2, and BC3 are three biological clones from HCV p0). A caret at the tip of a line represents heterogeneity at that nucleotide position (two peaks in the same sequence position, with the frequency range given in the bottom box). The NS3 mutation indicated by a vertical green line present in BC1 and BC3 is the result of segregation of a nucleotide mixture in the uncloned population. Mutations in the biological clones that were not detected in the corresponding parental population are indicated by vertical gray lines below the genome. (B) Venn diagram of mutations (counted relative to the plasmid Jc1FLAG2[p7-nsGluc2A] sequence) that are shared among the biological clones. (C) Diagram of mutations (counted relative to the consensus sequence of HCV p0 population) that are shared among the biological clones. (D) Diagram indicating new mutations (those that were not found in the parental HCV p0 population) that are shared among the biological clones.

