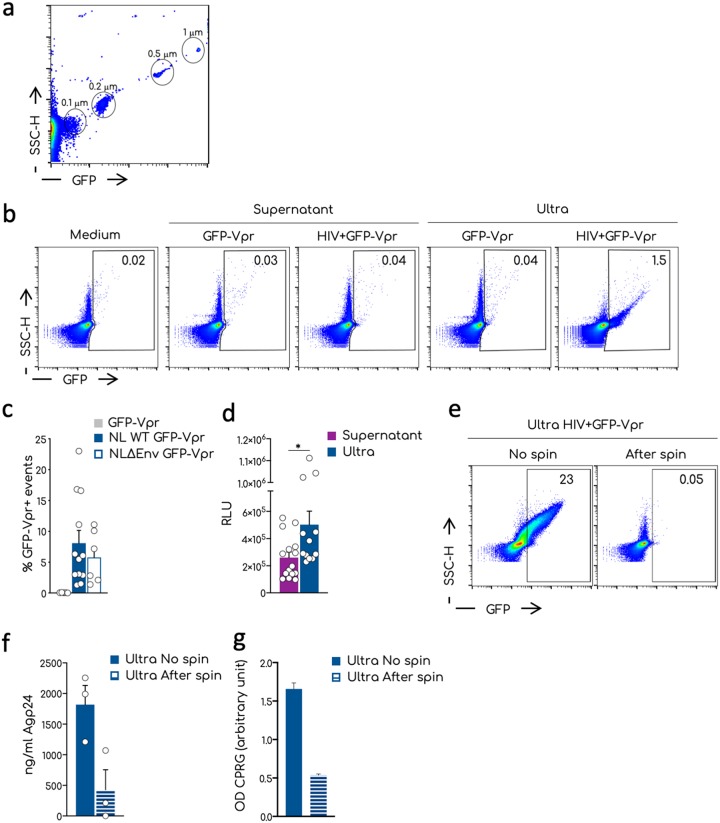
FIG 1.
Visualization by flow virometry of nanoparticles and HIV-1 aggregates. (a) Representative dot plot analysis of the commercial nanoparticles GFP+ acquired on the standard cytometer Attune NTx. Different sizes of the beads are indicated in the gates. (b) Representative dot plots of the analysis of viral productions by flow virometry. Culture medium, supernatants, or ultracentrifuged supernatants (ultra) were acquired at the Attune NTx using the same setting established for the nanobeads in panel a. Numbers in the gates indicate the percentages of the GFP-Vpr+ events. (c) Mean and standard errors of the mean (SEM) of the percentages of the GFP-Vpr+ events in the ultra of multiple independent viral stocks of the NL4-3 and NL4-3ΔEnv viruses. Negative control corresponds to the ultra of the GFP-Vpr alone supernatants. Each dot corresponds to one independent viral preparation. (d) Infectivity of the viral supernatants versus the corresponding ultra. TZM-bl cells were exposed to the same amount of Gag-p24 and luciferase activity measured 36 h after infection. The means and SEM of at least three independent experiments conducted in triplicate are shown as relative luminescence units (RLU). (e) Representative dot plots of the procedure used to remove aggregates from ultra. Ultra were left untreated (No spin) or spun for 15 min at 20,000 × g. The supernatant devoid of aggregated particles was recovered (After spin) and analyzed by flow virometry. Numbers indicate the percentages of GFP+ events in the gate. (f) Quantification by ELISA of the HIV-1 Gag-p24 associated with the ultra treated as shown in panel e of three independent experiments. (g) Infectivity of the viral particles of the samples measured in panel f. Means and SEM are shown. Statistical analysis was performed using the Prism software and a multiple unpaired t test. *, P < 0.05.

