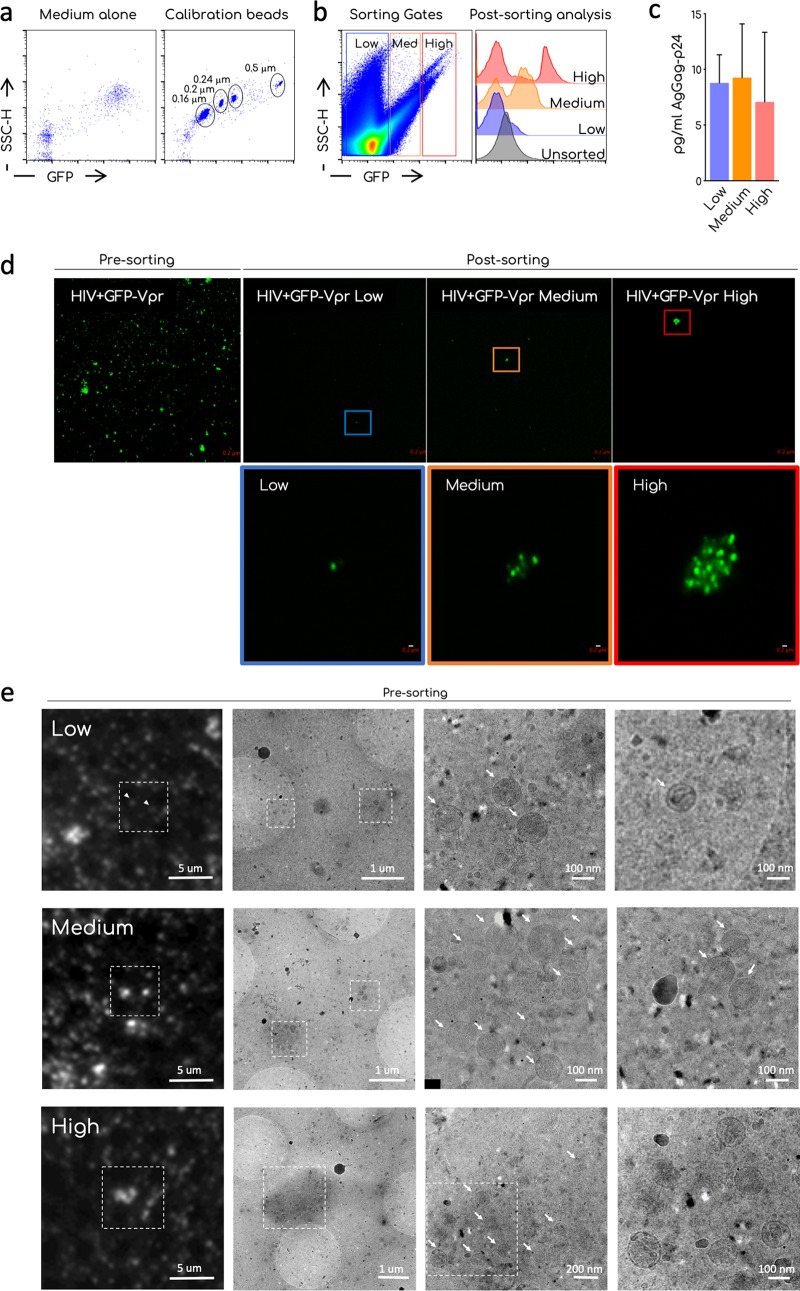
FIG 2.
Sorting and microscopy analysis of ultracentrifuged viral preparations. (a) Representative dot plot analysis of the commercial nanoparticles GFP+ acquired on the standard cytometer MoFLO Astrios. The background noise of the instrument (medium alone) and the calibration beads are shown. Different sizes of the beads are indicated in the gates. (b) Sorting strategy. Ultracentrifuged viral preparations (Ultra) were acquired on a MoFLO Astrios cytometers and arbitrary gates on the GFP– and GFP+ samples were designed to sort aggregates accordingly with their relative fluorescence (low, medium, and high). Histogram overlay shows the efficiency of sorting. Unsorted ultra and postsorting low, medium, and high GFP samples are compared. A representative sorting out of at least four is depicted. (b) Quantification by ultrasensitive SIMOA digital ELISA of the HIV-1 Gag-p24 associated with the sorted fractions. Means and SEM of two independent quantifications are shown. (c) Confocal analysis of unsorted ultra (presorting) and postsorting fraction (low, medium, and high). Images were taken using an LSM-700 confocal microscope and a 63× objective. The magnification shows the 10× digital zoom on the indicated aggregates. Scale bar, 0.2 μm. (d) CLEM analysis of unsorted ultra. Ultra were left to settle on a TEM grid. GFP low, medium, or high aggregates were identified in the sample and imaged using a fluorescence microscope. The grid was then processed on a TEM and sample imaged to identify viral particles in the aggregates. Arrows indicates single virions. Scale bars, 1 μm to 100 nm.

