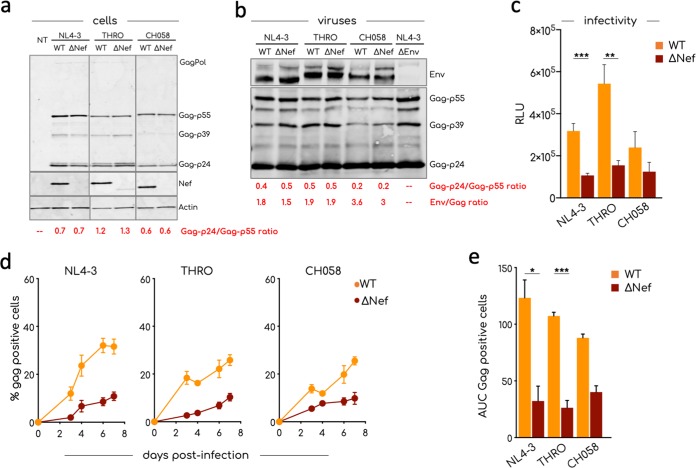
FIG 3.
Characterization of viral isolates. (a) Western blot analysis of cell lysates of 293T cells transfected with the indicated viral strains. 293T cells were transfected, and cell lysates were prepared 48 h after transfection. The expression of Gag, Nef, and actin in cells was determined with specific antibodies. A lysate from nontransfected (NT) cells was used as negative control. A representative Western blot of two is shown. (b) Western blot analysis of purified aggregated viral particles. The incorporation of HIV-1 Env and Gag was determined with specific antibodies. The ratio Env/Gag indicated at the bottom of each lane was calculated after the analysis of the fluorescent signal associated with Gag and Env band using the Image Studio Lite software. One of two blots is shown. (c) Infectivity of viral particles. A TZM-bl cell-based infectivity assay was used to calculate the infectivity of the indicated viral strains. The means and SEM of the RLU in at least three independent assays, each conducted in triplicate, are shown. (d) The means and SEM of the replication of the indicated viral strains in activated primary CD4+ T cells derived from four healthy donors are shown. Primary CD4+ T cells were infected, and viral replication was monitored by flow cytometry over a week as the percentage of Gag+ cells. (e) Area under the curve (AUC) of graph plotted in panel d. Statistical analysis was performed using the Prism software and a multiple unpaired t test (c) and an unpaired t test (e). *, P < 0.05; **, P < 0.005; ***, P < 0.0005.

