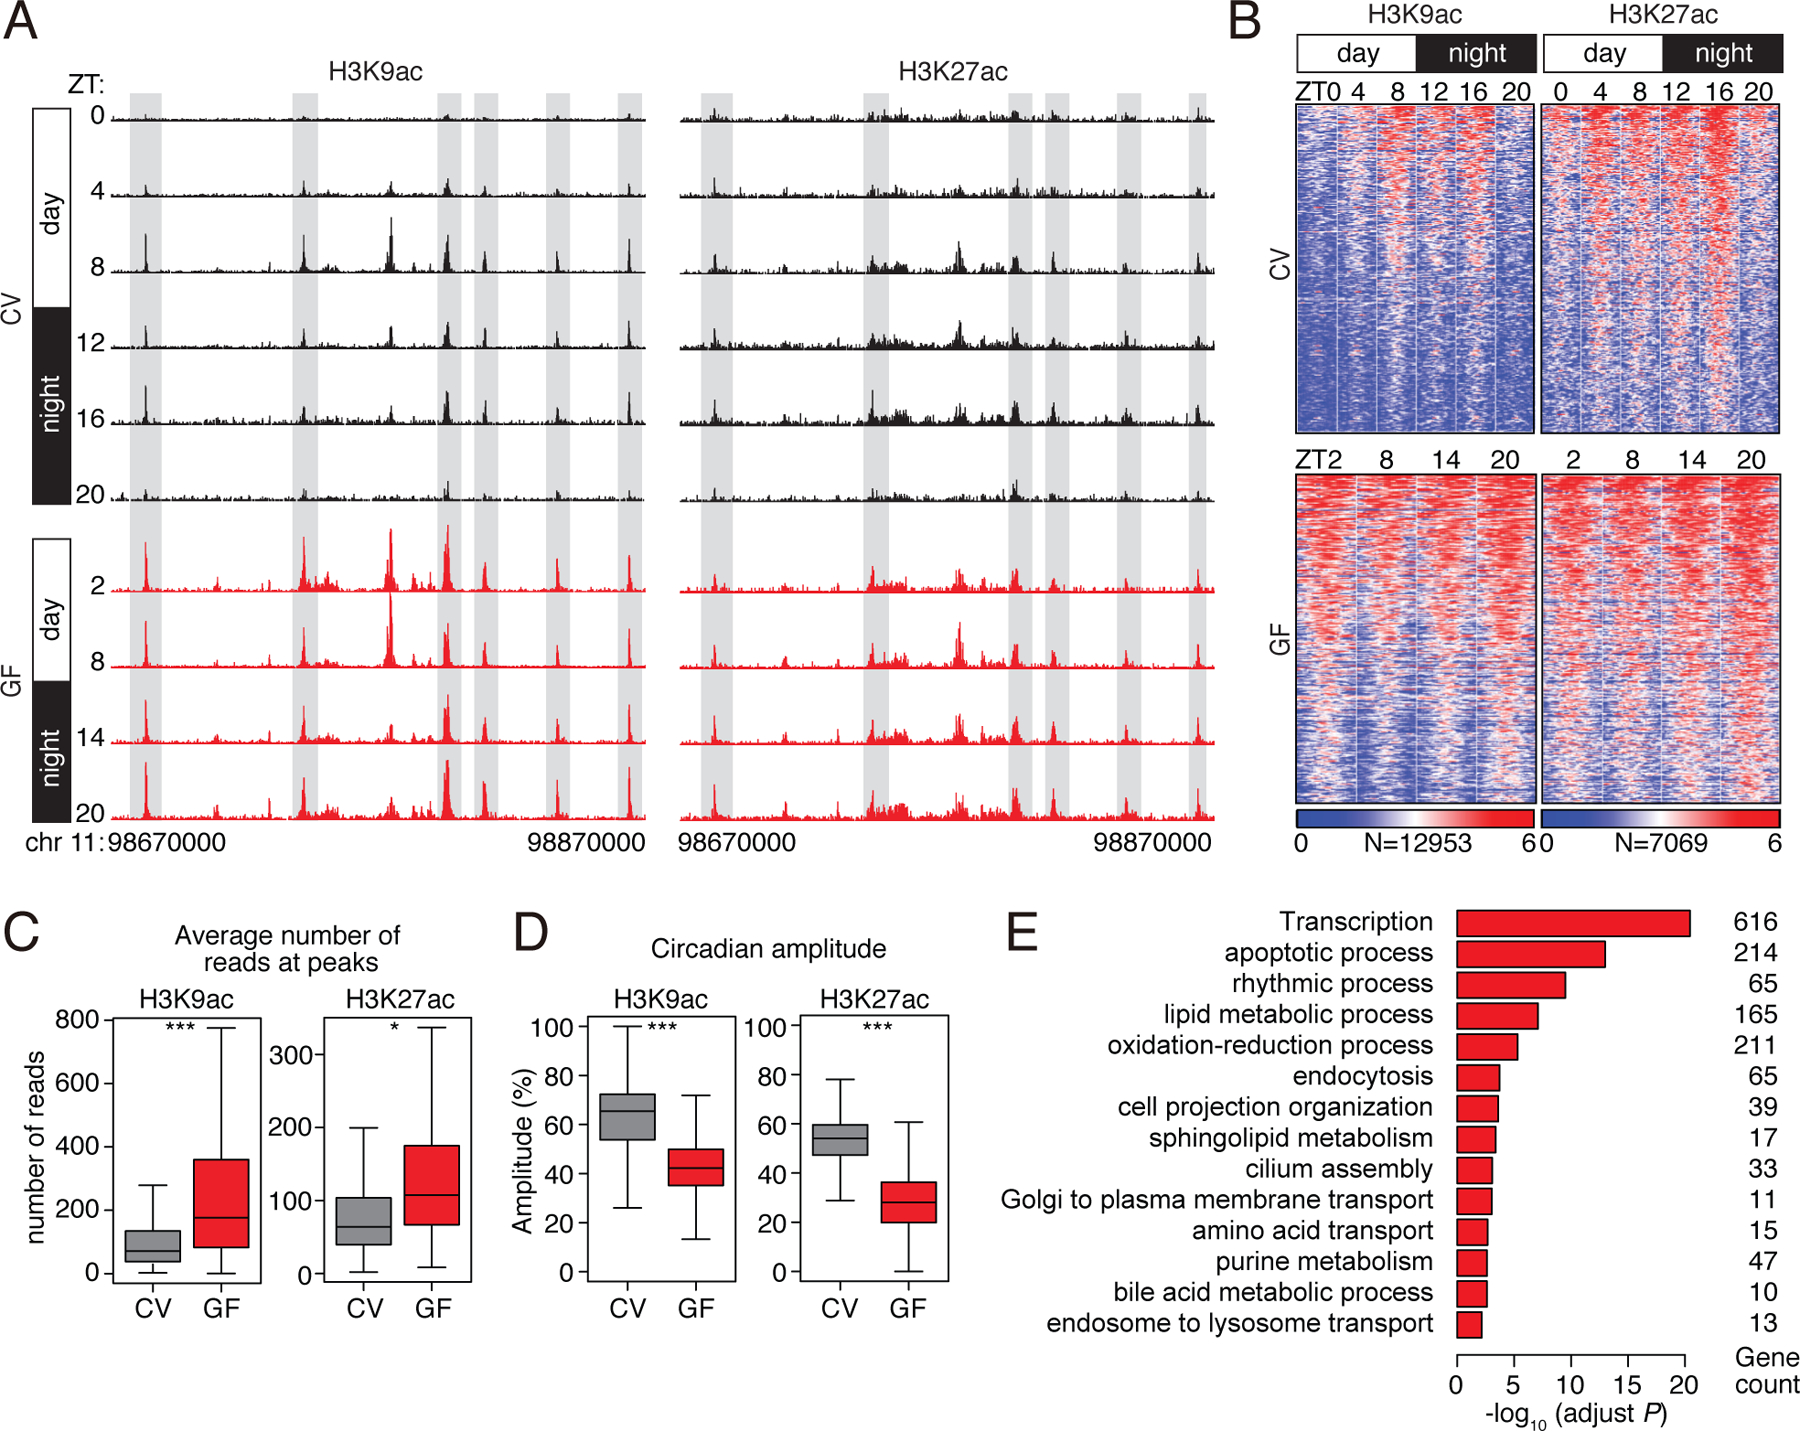
Figure 1: Histone acetylation in small intestinal epithelial cells exhibits synchronized diurnal rhythmicity that depends on the microbiota.

(A) Genome browser view of the 200 kb region surrounding the Nr1d1 locus, showing ChIP-seq analysis of H3K9ac and H3K27ac marks in small intestinal epithelial cells. The analysis was done across a circadian cycle in CV and GF mice. Each track represents the normalized ChIP-seq read coverage at a single time point. Examples of peaks showing microbiota-dependent diurnal rhythmicity are highlighted in gray. N=3 pooled biological replicates per library. (B) Heat maps of H3K9ac and H3K27ac signals (log (reads at 50 bp windows)) from −1 to +1 kb surrounding the centers of all cycling H3K9ac and H3K27ac peaks (adjust P<0.01 by JTK). Each peak in the genome is represented as a horizontal line, ordered vertically by signal strength, and the analysis was done across a circadian cycle in CV and GF mice. The number of peaks in the genome is indicated at the bottom. The blue-red gradient indicates the coverage or signal strength (normalized uniquely mapped reads per 20 million reads). Intensity (C) and amplitude (D) of H3K9ac and H3K27ac peaks in CV and GF mice. *P<0.05, ***P<0.001 by one-tailed paired t-test. (E) Enriched GO categories in genes having H3K9ac- and H3K27ac-targeted genes as determined by the DAVID GO analysis tool. ZT, Zeitgeber; CV, conventional; GF, germ-free.
