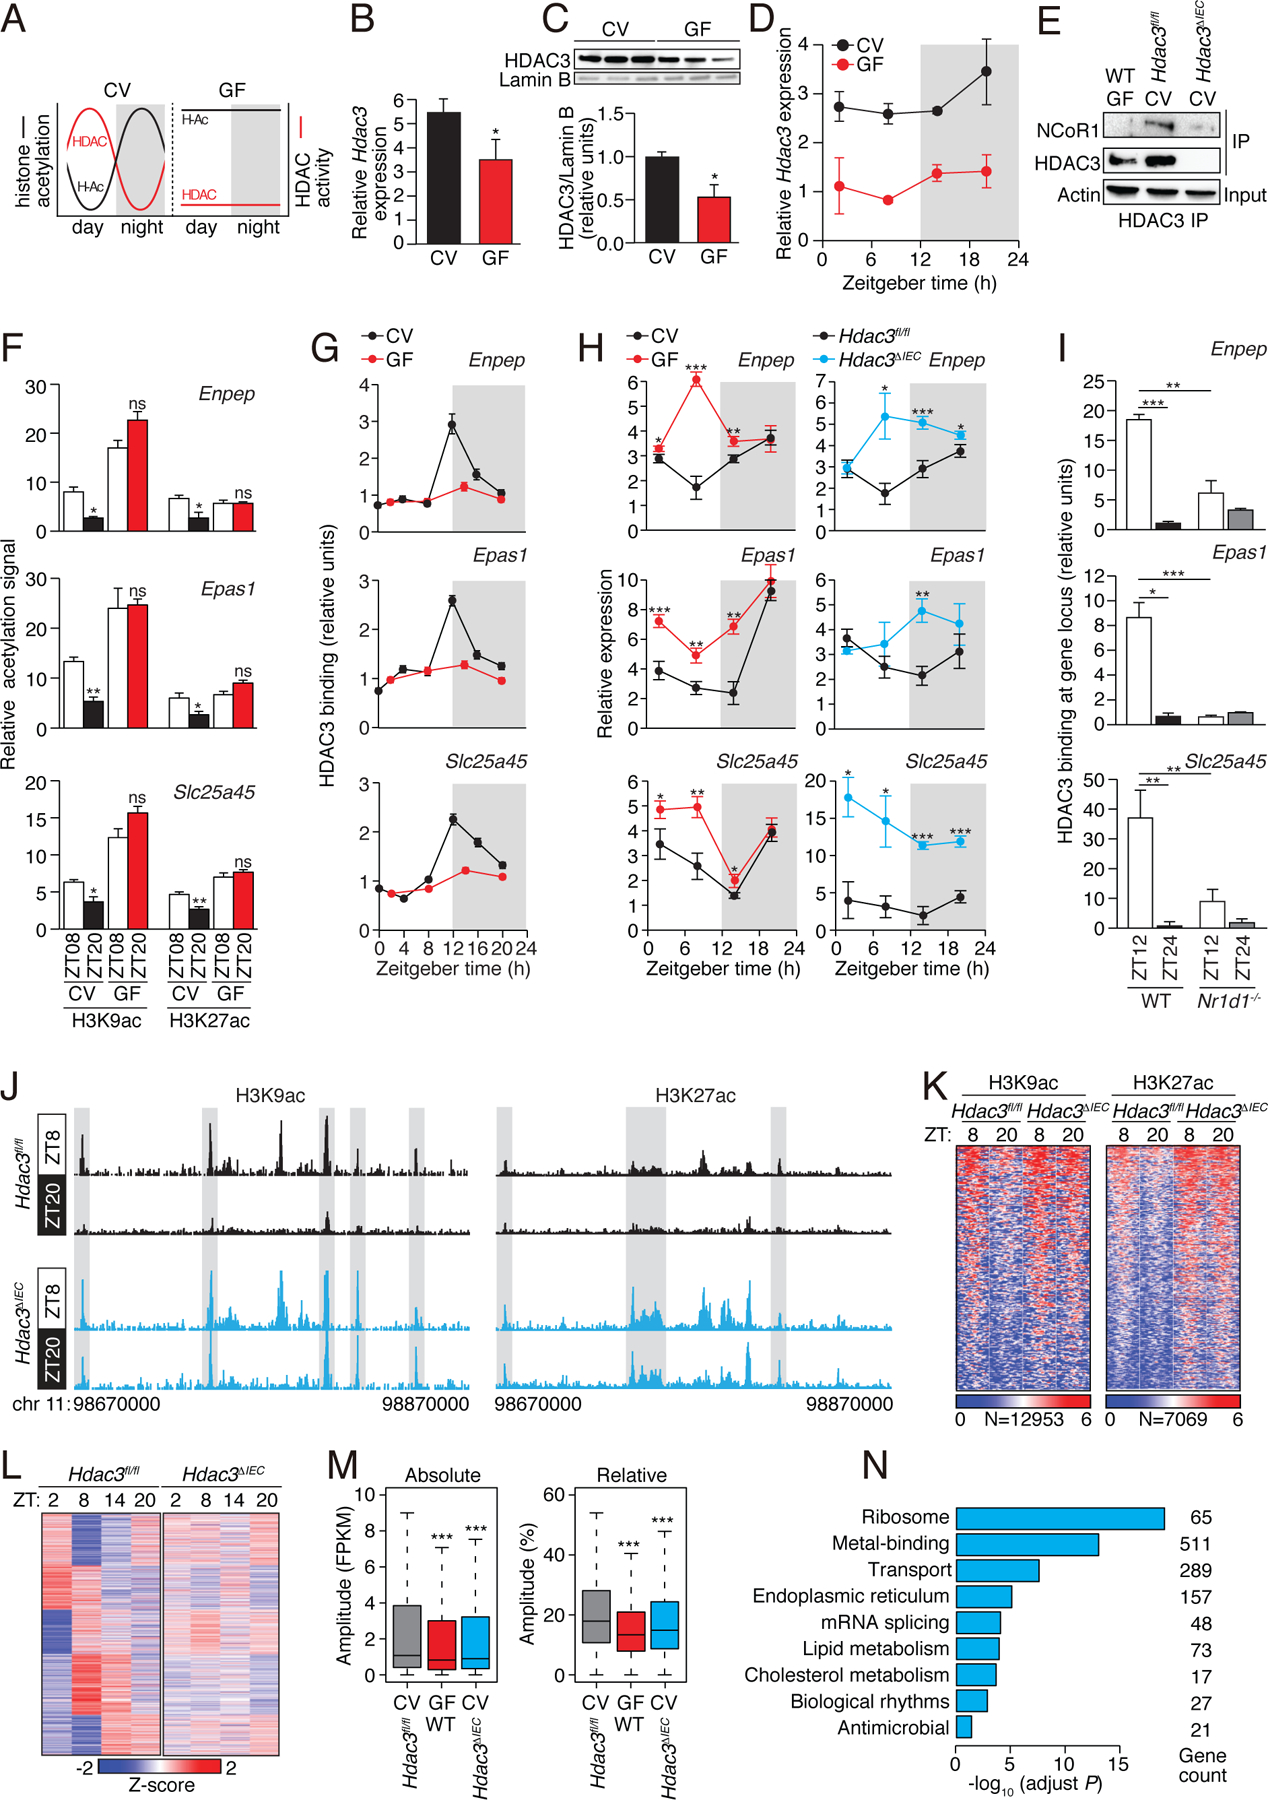
Figure 2: The intestinal microbiota programs the diurnal rhythmicity of epithelial histone acetylation and gene expression through HDAC3.

(A) Schematic diagram summarizing the diurnal histone acetylation pattern in CV and GF mice shown in Fig. 1, which suggests a loss of HDAC function in GF mice. (B) RT-qPCR analysis of Hdac3 transcripts in IECs from CV and GF mice at ZT8. N=3 mice per group. (C) Western blot of HDAC3 and Lamin B (loading control) in IECs from protein in intestinal epithelial cells from CV and GF mice at ZT8. Bands were quantified by scanning densitometry and normalized to the Lamin B band intensity. (D) RT-qPCR analysis of Hdac3 transcript abundance in epithelial cells from GF and CV mice across a 24-hour cycle. N=3 mice per group. (E) Co-immunoprecipitation of endogenous HDAC3 and NCoR1 in IECs from GF WT mice and CV Hdac3fl/fl and Hdac3ΔIEC mice. N=3 pooled biological replicates per lane. (F,G) Relative abundance of H3K9ac and H3K27ac marks (F) and bound HDAC3 (G) at the promoters of Enpep, Epas1 and Slc25a45 in CV and GF as determined by ChIP-qPCR analysis. N=3 mice per time point per group. (H) RT-qPCR analysis of Enpep, Epas1 and Slc25a45 transcript abundance in IECs from CV and GF mice or Hdac3fl/fl and Hdac3ΔIEC mice across a 24-hour cycle. N=3 mice per group. (I) Relative abundance of bound HDAC3 at the promoters of Enpep, Epas1 and Slc25a45 in small intestinal epithelial cells from WT and Nr1d1−/− mice as determined by ChIP-qPCR analysis. N=3 mice per time point per group. (J) Genome browser view of the 200 kb region surrounding the Nr1d1 locus, showing ChIP-seq analysis of H3K9ac and H3K27ac marks in small intestinal epithelial cells from Hdac3fl/fl and Hdac3ΔIEC mice. N=3 pooled biological replicates per library. (K) Heat maps of H3K9ac and H3K27ac signals (log (reads at 50 bp windows)) from −1 to +1 kb surrounding the centers of all cycling H3K9ac and H3K27ac peaks. (L) Heat map showing diurnal gene expression patterns in IECs from Hdac3fl/fl and Hdac3ΔIEC mice across a 24-hour cycle by RNA-seq. N=3 pooled biological replicates per library. (M) Absolute (Fragments Per Kilobase of transcript per Million mapped reads, FPKM) or relative oscillating amplitudes of transcripts in GF WT mice and CV Hdac3fl/fl and Hdac3ΔIEC mice. N=3 mice per group. (N) Enriched GO categories of genes with decreased cycling amplitudes as determined by DAVID. *P<0.05; **P<0.01; ***P<0.001; ns, not significant by two-tailed t-test. Means±SEM (error bars) are plotted. GF, germ-free; CV, conventional; ZT, Zeitgeber time.
