
Figure 4: Intestinal epithelial HDAC3 controls lipid absorption in the intestine.
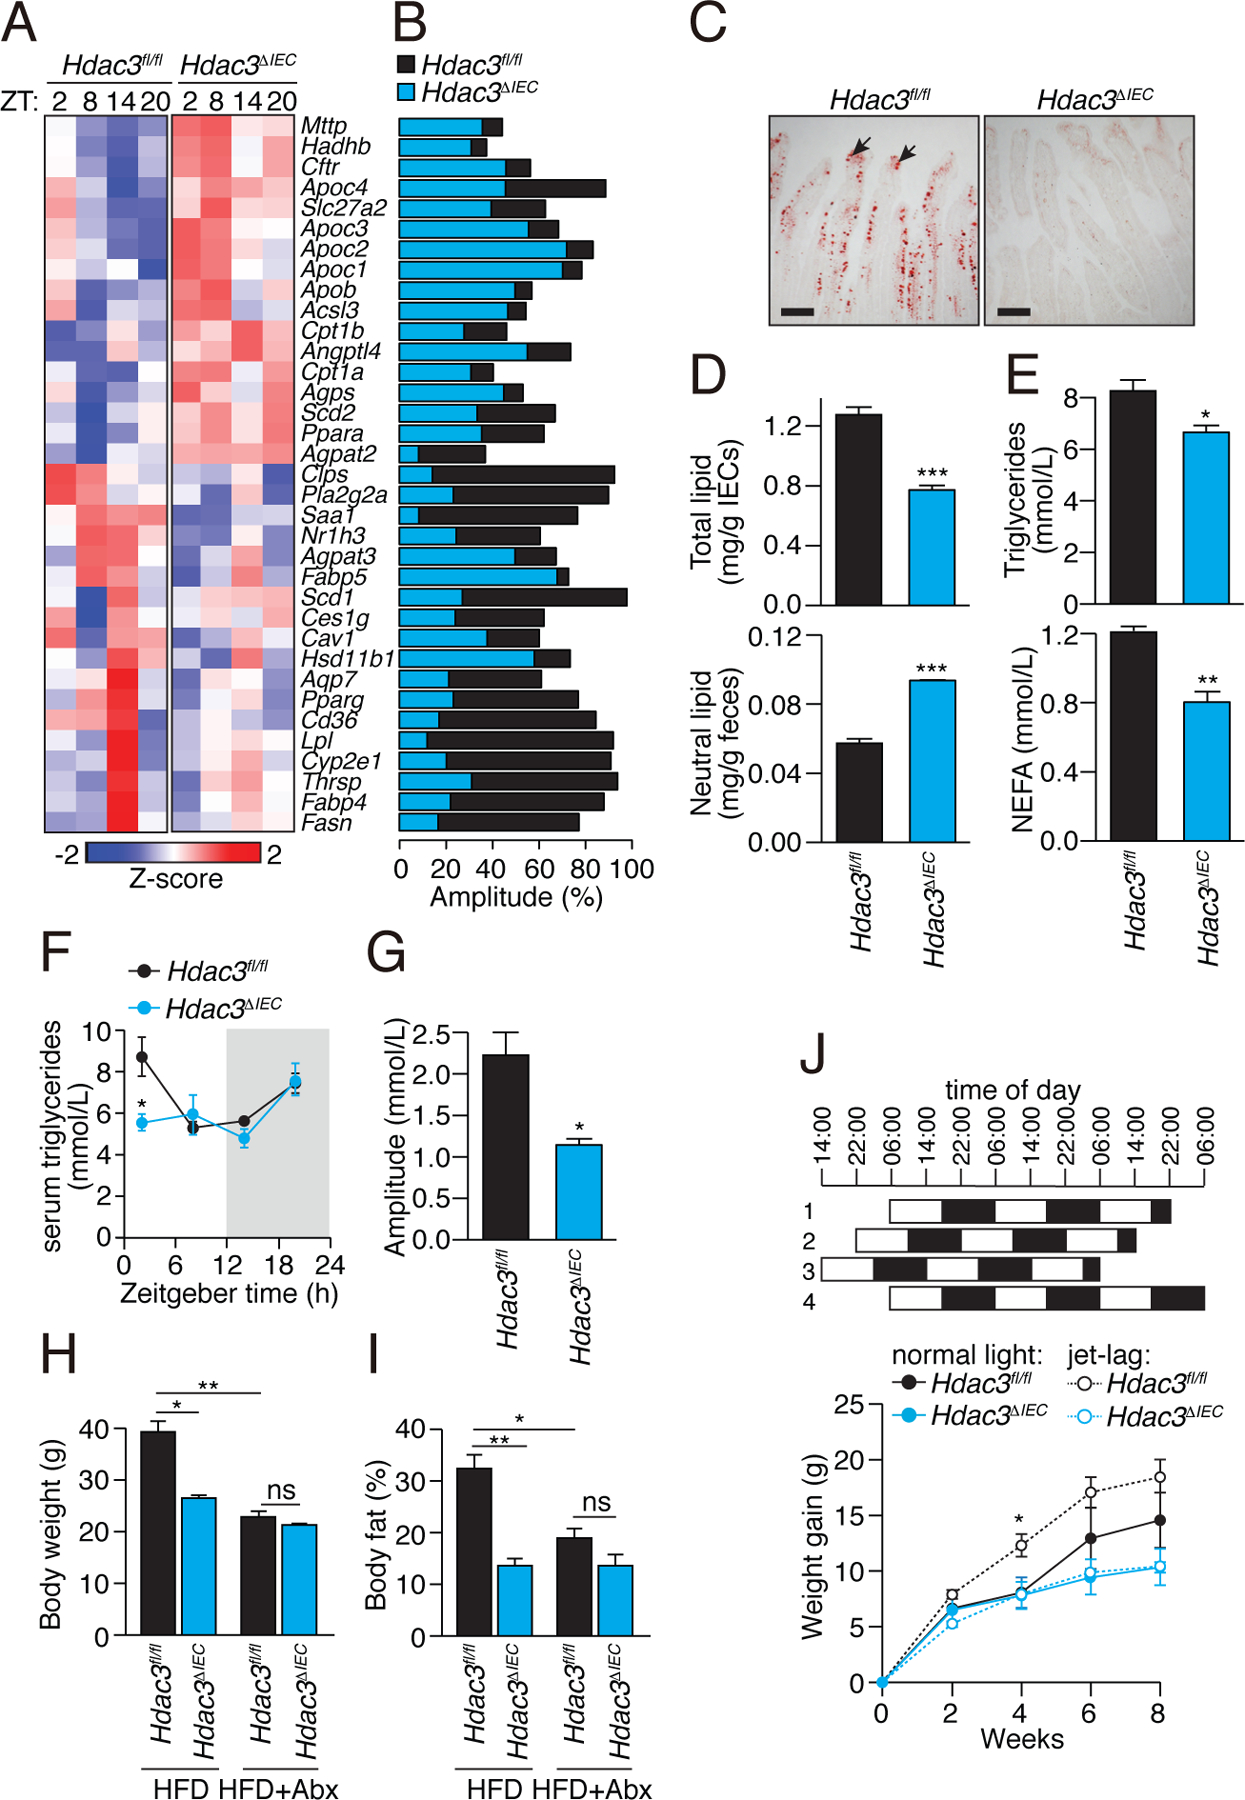
(A) Diurnal expression pattern of lipid metabolic genes in IECs from Hdac3fl/fl and Hdac3ΔIEC mice IECs is represented by a heat map, with amplitudes shown in (B). (C) Oil red O staining of lipids in small intestines of Hdac3fl/fl and Hdac3ΔIEC mice fed a HFD. Intestines were harvested at ZT8. Black arrows indicate epithelial cells. Scale bars=100 μm. (D) Quantification of total lipids (at ZT8) in IECs and neutral lipids in feces from Hdac3fl/fl and Hdac3ΔIEC mice fed a HFD. N=6, 5 mice per group. ***P<0.001 by two-tailed t-test. (E) Quantification of triglycerides and free fatty acids (at ZT4) in serum from Hdac3fl/fl and Hdac3ΔIEC mice fed a HFD. N=6, 5 mice per group. *P<0.05; **P<0.01 by one-tailed t-test. (F) Diurnal oscillations of serum triglyceride concentrations in Hdac3fl/fl and Hdac3ΔIEC mice fed a chow diet, with amplitudes shown in (G). N=3 mice per group. *P<0.05 by one-tailed t-test. Statistical test for circadian rhythms: P=0.002 for Hdac3fl/fl and P=0.287 for Hdac3ΔIEC mice. (H,I) Weight (H) and body fat percentage (I) of Hdac3fl/fl and Hdac3ΔIEC mice fed a HFD with or without antibiotics for 10 weeks. N=5 mice per group. *P<0.05; **P<0.01; ns, not significant by one-tailed t-test. (J) Weight gain in mice fed a HFD with or without jet lag. Jet lag was induced by an 8-hour light cycle shift every three days. N=5 mice per group). *P<0.05 two-tailed t-test. Means±SEM (error bars) are plotted. ZT, Zeitgeber time; HFD, high fat diet.