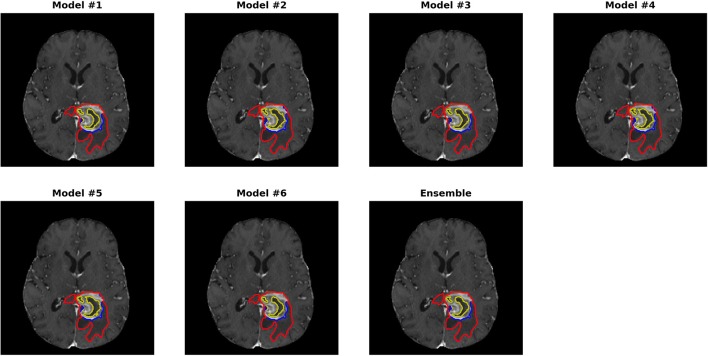
Figure 3.
Automatically segmented sub-regions from models 1–6 and the ensemble model. The underlying image is the corresponding T1Gd from the validation case “Brats18_CBICA_BHF_1.” Red, yellow and blue delineate the predicted boundaries of the total tumor, enhanced tumor core, and peritumoral edema, respectively.

