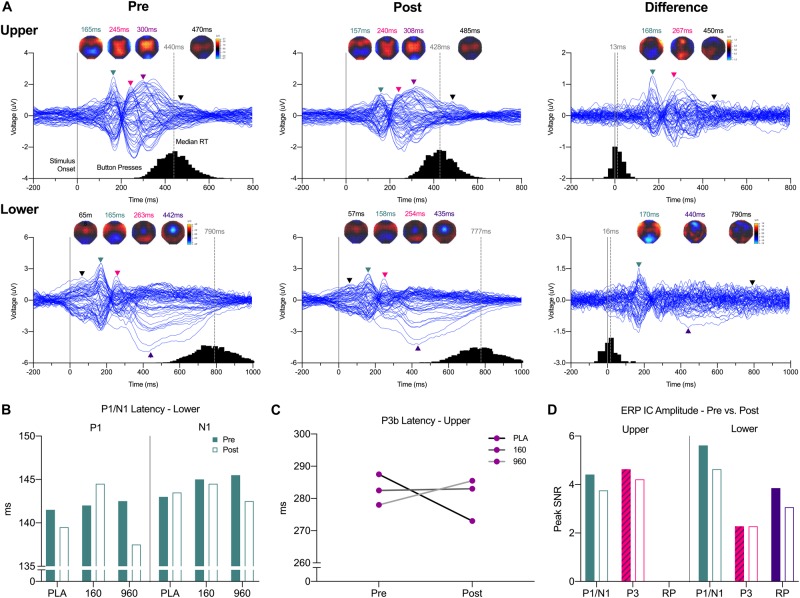
FIGURE 2.
Event-Related Potential Waveforms, Response Times, and Interpolated Scalp Maps. (A) Grand-averaged 64-channel ERP tracings for each segment and timepoint plus the pre- minus post-exercise difference waveform (expanded 10–20 montage, common average reference). Waveforms are time-locked to stimulus presentation (solid gray line at 0 ms). For each trace, histograms of all qualifying response times are provided on the X-axis, with median response time indicted above the gray dashed lines. Black lines Triangles correspond to spherical spline interpolated 2D scalp voltage topography maps at the indicated time points with colors matched to identified ERP components and post-exercise map intensity scaled in relation to the corresponding pre-exercise condition. (B) Grand-averaged lower body P1/N1 latencies were reduced after exercise with 960mg, while a (C) dose-dependent increase in P3b latency after exercise was evident for the upper body. (D) As indicated by ICs for each respective ERP, amplitudes were generally lower after exercise. ERP, event-related potential; IC, independent component.

