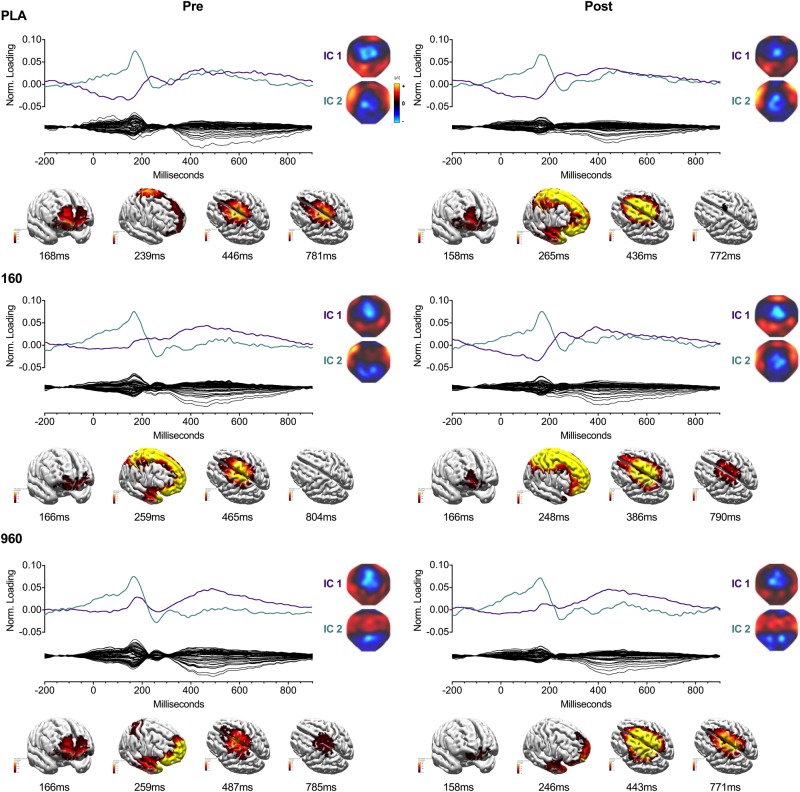
FIGURE 4.
IC Waveforms and CDRs for Lower-Body Stimuli. Two ICs were identified from the grand-averaged 64-channel ERP waveforms. For each treatment and timepoint, IC waveforms are depicted in the upper axis and matched by color and ERP correspondence, with the IC-filtered grand average waveform depicted on the lower axis. Spherical spline interpolated 2D scalp load distribution maps for each component are depicted to the right of the waveforms. IC-based sLORETA CDR localizations are provided at the bottom of each panel (common average reference). The displayed perspectives emphasize areas of maximal activation common to each treatment and timepoint. Intensities of 2D maps and source plots are scaled in relation to pre-exercise Placebo values for each component (maps) or timepoint (sources). For source plots, activation was clipped at 50% to emphasize the most prominent sources. Source activity is displayed in pseudo-F scale units, with a regularization factor of λ = 221. ERP, event-related potential; IC, independent component; sLORETA: standardized low-resolution brain electromagnetic tomography; CDR, current density reconstruction.

