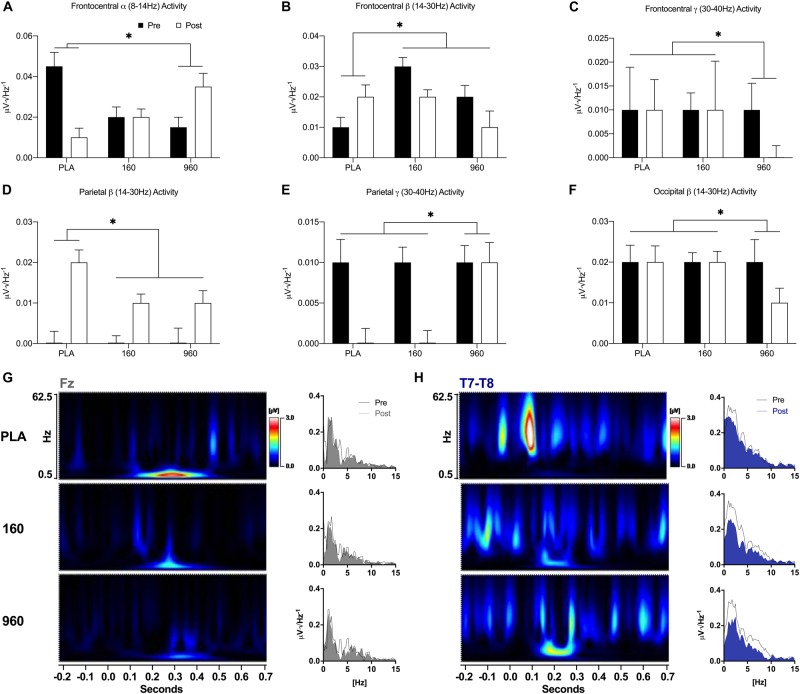
FIGURE 5.
Event-Related Oscillatory Activity for Upper-Body Stimuli. (A–F) FFTs were applied to ERPs from –500 to 1000 ms with a Hann Filter (10% width). Spectral activity was binned from 0.5 to 4.0 Hz (delta), 4.0 to 8.0 Hz (theta), 8.0 to 14.0 Hz (alpha), 14.0 to 30.0 Hz (beta), and 30.0 to 40 Hz (gamma). Each plot depicts grand-averaged spectral activity (mean ± SE) for regions with statistical interactions between treatment and timepoint (∗ = p ≤ 0.05). Black and open bars indicate pre- and post-exercise values, respectively. (G–H) Time-varying and overall phase-locked spectral activity was examined with spectrograms and spectrum plots of grand-averaged ERPs using wavelet analysis (Mexican Hat, resolution = 1.0Hz, Teager-Kaiser, 0.5–62.5 Hz activity, and –200 to 700 ms) and FFTs for midline (Fz, Cz, Pz, and Oz) and lateral electrode averages (C5–C6 and T7–T8) based on the results of quantitative ERP and FFT analyses. Spectrogram activity is interpolated and scaled against pre-exercise placebo values specific to each sensor. For sensors that displayed qualitative dose-dependent responses (Fz and T7–T8), spectrograms are difference plots (pre- minus post-exercise activity) while the spectrum plots display 0–15 Hz activity with pre- and post-exercise activity overlaid. FFT, fast Fourier transform; ERP, event-related potential.

