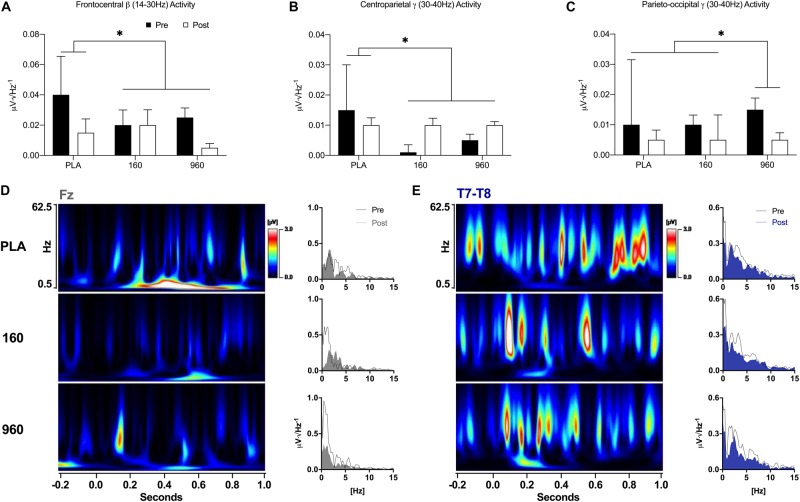
FIGURE 6.
Event-Related Oscillatory Activity for Lower-Body Stimuli. (A–C) FFTs were applied to ERPs from –500 to 1000 ms with a Hann Filter (10% width). Spectral activity was binned from 0.5–4.0 Hz (delta), 4.0–8.0 Hz (theta), 8.0–14.0 Hz (alpha), 14.0–30.0 Hz (beta), and 30.0–40 Hz (gamma). Each plot depicts grand-averaged spectral activity (mean ± SE) for regions with statistical interactions between treatment and timepoint (∗ = p ≤ 0.05). Black and open bars indicate pre- and post-exercise values, respectively. (D–E) Time-varying and overall phase-locked spectral activity was examined with spectrograms and spectrum plots of grand-averaged ERPs using wavelet analysis (Mexican Hat, resolution = 1.0Hz, Teager-Kaiser, 0.5–62.5Hz activity, –200 to 1000 ms) and FFTs for midline (Fz, Cz, Pz, and Oz) and lateral electrode averages (C5-C6 and T7-T8) based on the results of quantitative ERP and FFT analyses. Spectrogram activity is interpolated and scaled against pre-exercise placebo values specific to each sensor. For sensors that displayed qualitative dose-dependent responses (Fz and T7-T8), spectrograms are difference plots (pre- minus post-exercise activity) while the spectrum plots display 0–15 Hz activity with pre- and post-exercise activity overlaid. FFT, fast Fourier transform; ERP, event-related potential.

