Figure 5.

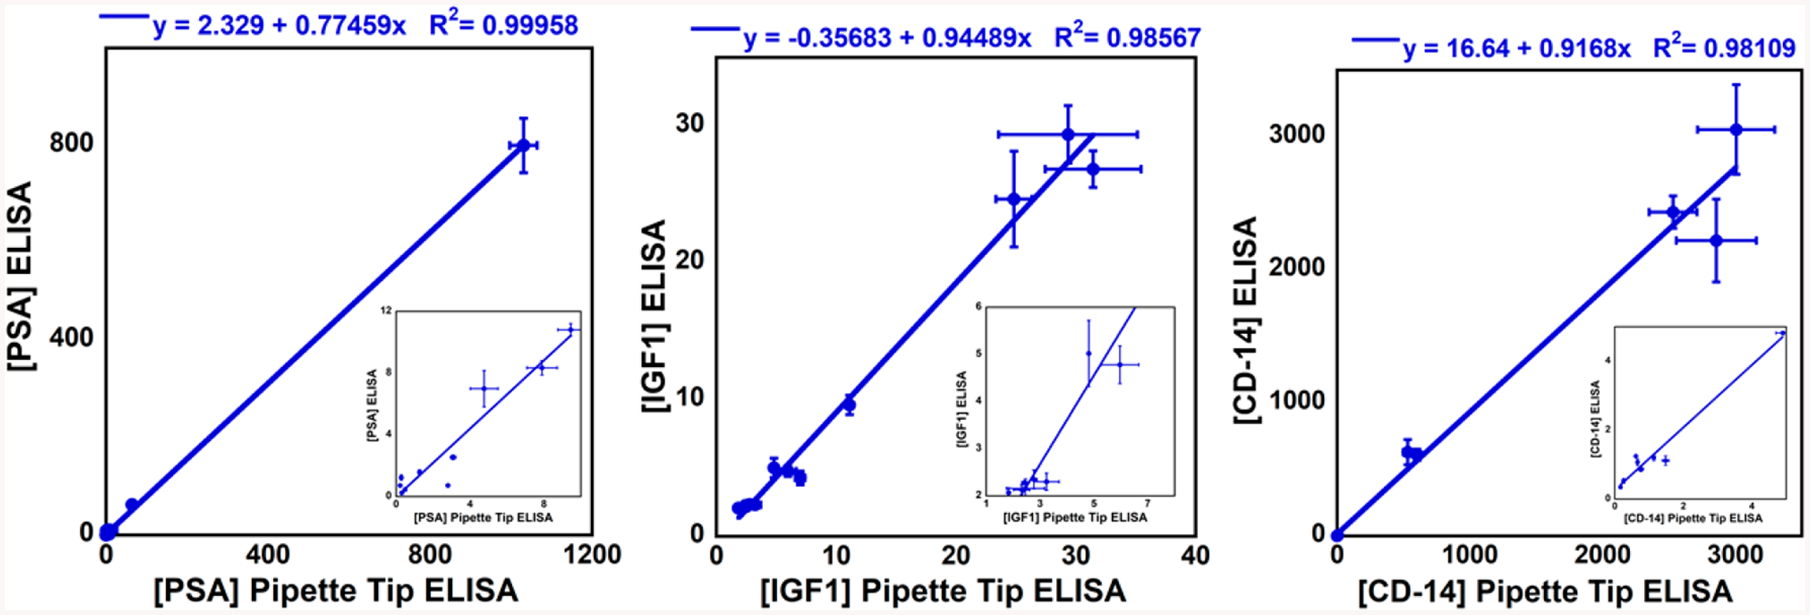
Linear correlations for pipet-tip ELISA vs microwell plate ELISA for (A) PSA, (B) IGF1, and (C) CD14, quantified in ng/mL (n = 3) in patient samples. Insets show low concentration ranges.

Linear correlations for pipet-tip ELISA vs microwell plate ELISA for (A) PSA, (B) IGF1, and (C) CD14, quantified in ng/mL (n = 3) in patient samples. Insets show low concentration ranges.