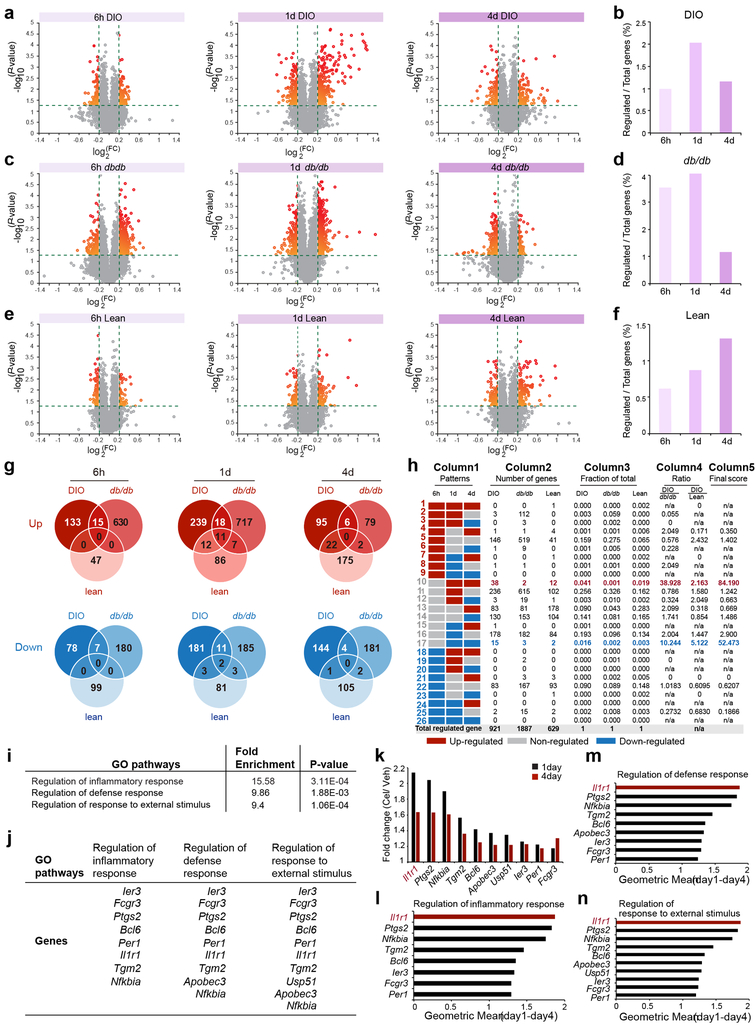
Figure 1. Identification of IL1R1 as a candidate mediator of celastrol’s action.
DIO, db/db, and lean mice were treated with either vehicle (Veh) or celastrol (Cel) for 6 h (250 μg/kg, i.p.), 1 d (100 μg/kg, i.p.), or 4 d (100 μg/kg, i.p., once a day), and total RNA was extracted from the hypothalamus for transcriptome analysis. (a, c, e) Volcano plots depicting regulation of the hypothalamic transcriptome by celastrol in DIO, db/db and lean mice: (a) DIO mice. n=3 mice (6 h, 1 d and 4 d) for vehicle-treated groups, n=4 mice (6 h and 1 d) or 3 mice (4 d) for celastrol-treated groups; (c) db/db mice. n=4 mice (6 h, 1 d and 4 d) for vehicle-treated groups, and n=3 mice (6 h) or 4 mice (1 d and 4 d) for celastrol-treated groups; (e) lean control mice. n=4 mice (6 h, 1 d and 4 d) for vehicle-treated groups, and n=4 mice (6 h) or 3 mice (1 d and 4 d) for celastrol-treated groups. Relative gene expression levels (fold change, FC) in the celastrol- versus vehicle-treated groups are plotted on the x-axes as mean log2 ratios (log2(FC)), while log10 transformed P-values are plotted on the y-axes (−log10(P-value)). Vertical and horizontal green dashed lines indicate FC and significance criteria ∣log2(FC)∣>0.2 and P<0.05 (two-tailed Student’s t-test). (b, d, f) The number of genes that surpassed threshold criteria as a percentage of the transcriptome in (b) DIO, (d) db/db and (f) lean mice at the 6 h, 1 d, and 4 d time points. (g) The number of up- or down-regulated genes that surpassed threshold criteria in DIO, db/db and lean mice at the 6 h, 1 d and 4 d time points. (h) Column 1 (Patterns): The 26 possible temporal patterns of celastrol-regulated genes (up-regulated, non-regulated, or down-regulated versus vehicle), by consideration of three time points (6 h, 1 d and 4 d). Column 2 (Number of genes): Number of genes that fell into each temporal pattern in DIO, db/db and lean mice. Total number of celastrol-regulated genes in each model are summed (at bottom). Column 3 (Fraction of total): Fraction of total celastrol-regulated genes in DIO, db/db and lean mice that fell into each temporal pattern. Column 4 (Ratio): The ratio of DIO to db/db and DIO to lean values in Column 3, showing the differential patterns in DIO group relative to db/db and lean groups. Column 5 (Final Score): Multiplication of Column 4 Ratio values (DIO/db/db × DIO/lean). (i) Identification of Gene Ontology (GO) pathways significantly enriched in genes found in Pattern 10 (n=38 genes, Fisher/Binominal test with Bonferroni adjusted P value). (j) Genes in each of the enriched pathways: (i) regulation of inflammatory response, ii) regulation of defense response, and iii) regulation of response to external stimulus. (k) The fold changes (Cel/Veh) in DIO mice at 1 day and 4 days for the individual Pattern 10 genes present in the identified GO pathways. (l-n) Geometric mean of 1-day and 4-day fold changes of these genes in the GO pathways (l) “Regulation of inflammatory response”, (m) “Regulation of defense response” and (n) “Regulation of response to external stimulus”.

