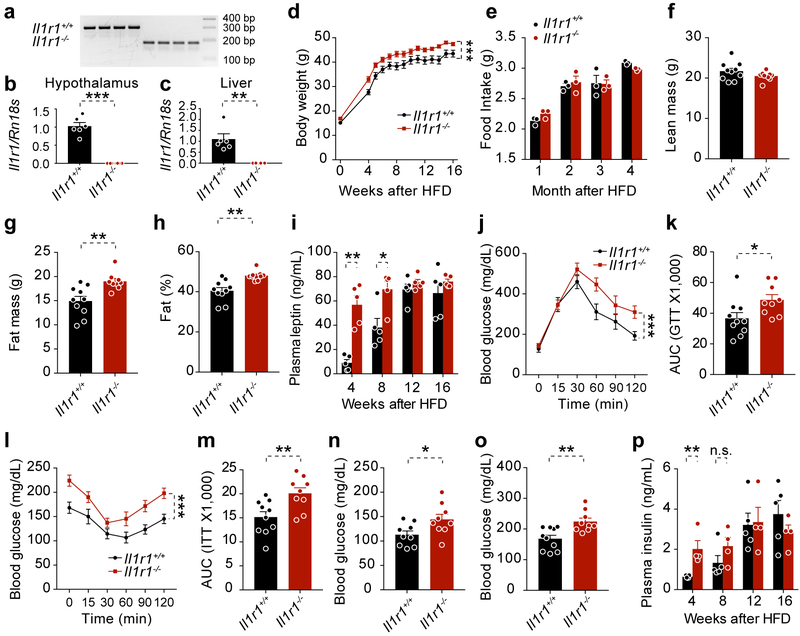
Extended Data Fig. 2. IL1R1 deficiency leads to significantly higher levels of obesity.
Il1r1−/− mice and their wild-type (Il1r1+/+) littermates were fed a HFD for 16 weeks to induce obesity. The experiments were repeated two times with similar results. (a) PCR analysis of Il1r1 locus in genomic DNA of Il1r1+/+ and Il1r1−/− mice. (b, c) qPCR analysis of Il1r1 mRNA levels in the (b) hypothalamus (P<0.0001) and (c) liver (P=0.007). n=6 for Il1r1+/+ group and n=4 for Il1r1−/− group. (d) Body weights of Il1r1+/+ and Il1r1−/− mice during HFD feeding (n=10 mice for Il1r1+/+ group and n=9 mice for Il1r1−/− group, P<0.0001). (e) Average 24-hour food intake per mouse after four, eight, 12, or 16 weeks of HFD feeding (n=3 cages for each group). (f-h) DEXA analysis of body composition after 16 weeks of HFD (n=10 mice for Il1r1+/+ group and n=9 mice for Il1r1−/− group): (f) lean mass (P=0.163), (g) fat mass (P=0.003) and (h) fat % (P=0.001). (i) Plasma leptin levels of Il1r1+/+ and Il1r1−/− mice at four, eight, 12 and 16 weeks of HFD feeding (n=5 for each group. 4 weeks, P=0.001; 8 weeks, P=0.02). (j) Blood glucose levels of Il1r1+/+ and Il1r1−/− mice during GTT performed after 10 weeks on HFD and (k) AUC analysis of GTT (n=10 mice for Il1r1+/+ group and n=9 for Il1r1−/− group. P=0.03). (l) Blood glucose levels of Il1r1+/+ and Il1r1−/− mice during ITT performed after 12 weeks on HFD and (m) AUC analysis of ITT (n=10 mice for Il1r1+/+ group and n=9 mice Il1r1−/− group. P=0.007). (n) 15-hour fasting blood glucose of Il1r1+/+ and Il1r1−/− mice after 10 weeks of HFD (n=10 mice for Il1r1+/+ mice and n=9 mice Il1r1−/− group. P=0.03). (o) Six-hour fasting blood glucose levels of Il1r1+/+ and Il1r1−/− mice after 12 weeks on HFD (n=10 mice for Il1r1+/+ group and n=9 mice Il1r1−/− group. P=0.003). (p) Plasma insulin levels in Il1r1+/+ and Il1r1−/− mice after 4, 8, 12 or 16 weeks on HFD (n=5 mice for Il1r1+/+ group and n=4 mice for Il1r1−/− group. 4 weeks, P=0.007; 8 weeks, P=0.184). Values indicate average ± s.e.m. P values were determined by two-way ANOVA with Bonferroni's multiple comparisons test (d, j and l) or two-tailed Student’s t test (b- c, e-i, k, m-p). * P < 0.05, ** P < 0.01, *** P < 0.001, n.s., not significant (P>0.05).

