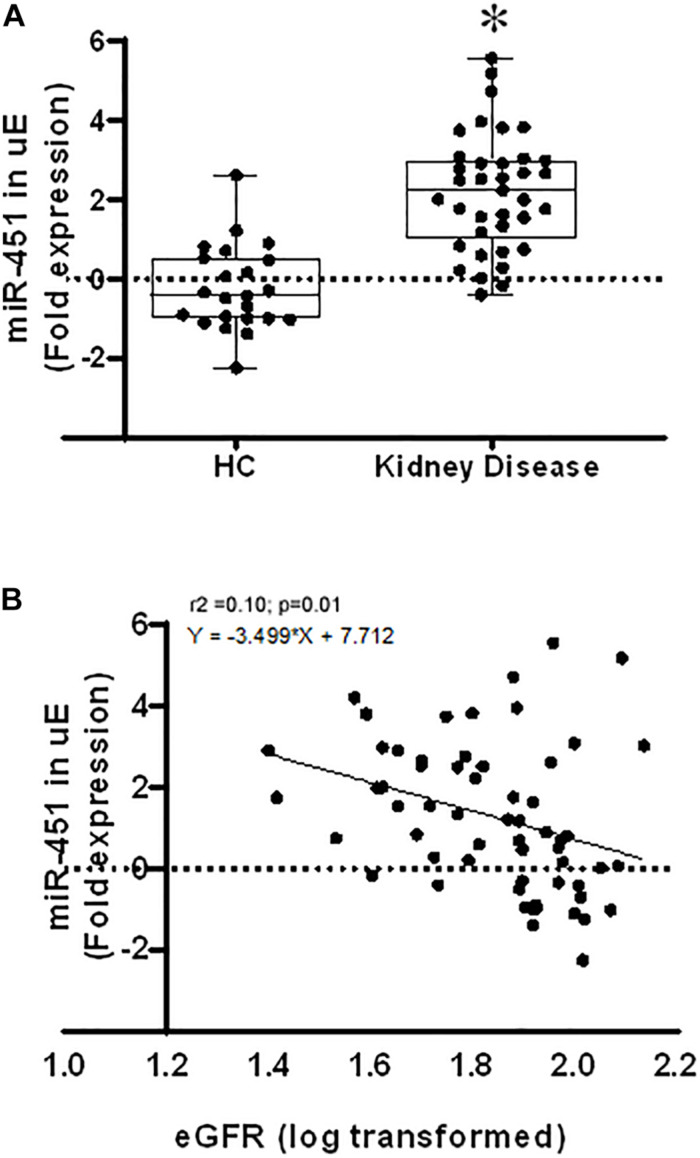
FIGURE 1.
MicroRNA 451 in human urinary exosomes (uEs) and its association with kidney disease. (A) Box and whisker plots and scatter plot of the uEmiR-451 fold expression in healthy subjects (n = 23) and kidney disease patients (n = 38). 18S ribosomal RNA was used as control gene to calculate the fold expression of miR-451 using the formulae 2–ΔCT. Values were log transformed. Whiskers extend down to smallest value and up to largest value. *p < 0.0001 was calculated by Mann–Whitney test. (B) Scatter plot shows Pearson’s correlation between the uE miR-451 fold expression and estimated glomerular filtration rate (eGFR) with a best fit line curve. A significant negative correlation was found between miR-451 and eGFR.

