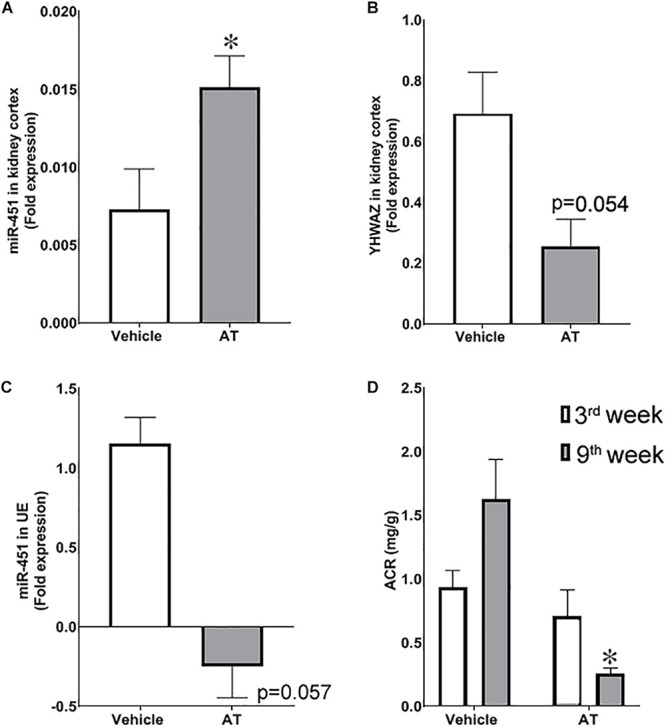
FIGURE 6.

Effect of renoprotection on renal levels of miR-451 and its target, YWHAZ, in diabetic rats. Bar graphs shows fold expression of (A) miR-451 and (B) YWHAZ messenger RNA (mRNA) in the kidney cortex and (C) miR-451 in urinary exosomes of diabetic rats treated with atorvastatin (AT) or vehicle for 8 weeks. The 18S ribosomal RNA was used as control gene to calculate the fold expression using the formulae 2–ΔCT. (D) Bar graph represents urine ACR at third and eighth weeks in these rats. *p < 0.05 was considered significant by unpaired t-test.
