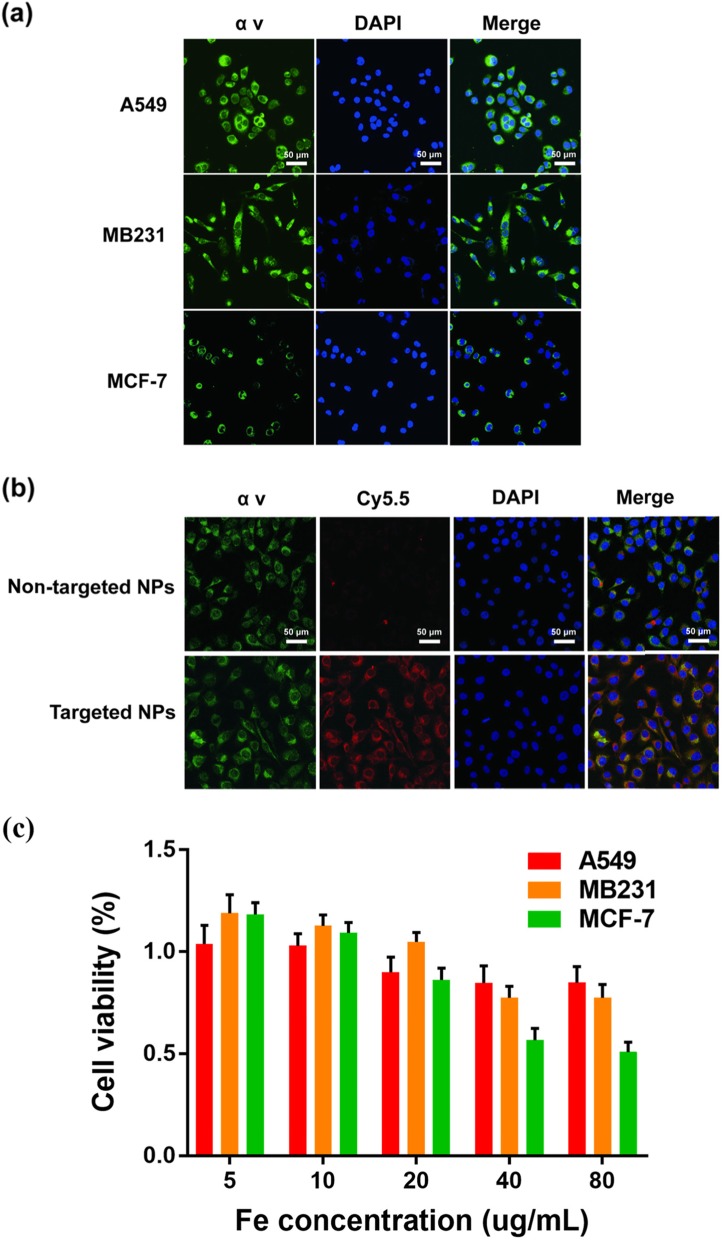
Fig. 2.
a Confocal fluorescence images with the expression of αv integrin on MB231, A549, and Mcf-7 cells. Blue and green represent DAPI and αv fluorescence, respectively. b Confocal fluorescence images of MB231 cells incubated with targeted Fe3O4/Na2CO3@PLGA/Cy5.5/cRGD NPs and non-targeted NPs. Blue, red, and green, represent DAPI, Cy5.5, and α v fluorescence, respectively. c Relative viability of MB231 cells incubated with different concentrations of Fe3O4/Na2CO3 @PLGA/Cy5.5/cRGD NPs

