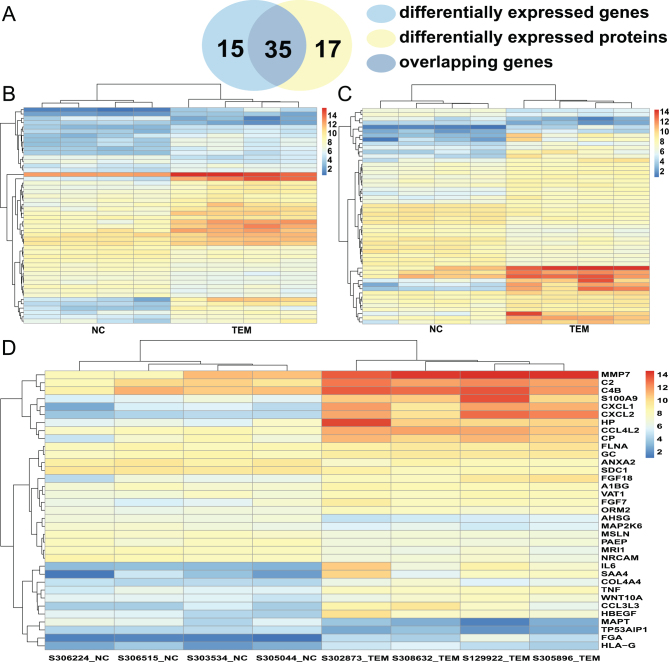
Figure 2.
(A) Venn diagram displaying 35 commonly deregulated mRNAs/proteins from 50 DEGs and 52 DEPs. (B) Hierarchical heatmap of DEGs comparing patients with tubal endometriosis (tubal EM) and Non-endometriosis Control (NC). (C) Hierarchical heatmap of DEPs comparing patients with tubal EM and NC. (D) Hierarchical heatmap of 35 commonly deregulated mRNAs/proteins comparing patients with tubal EM and NC.

 This work is licensed under a