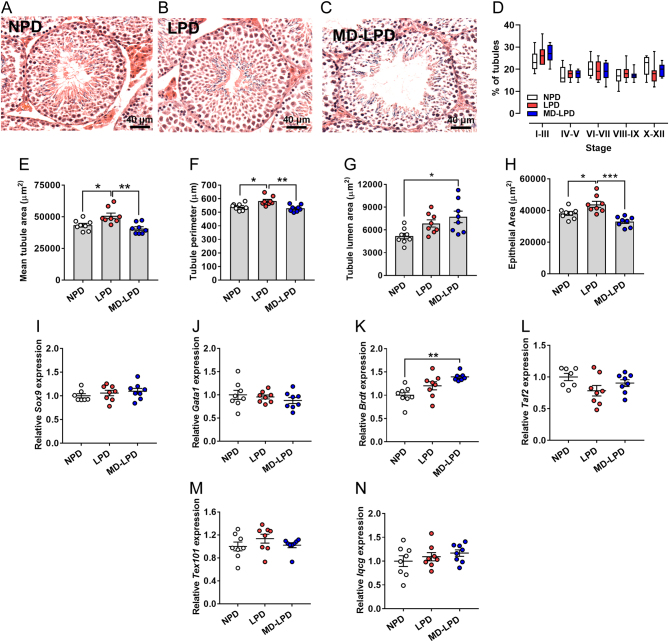
Figure 3.
Impact of NPD, LPD and MD-LPD on testicular morphology. Representative cross section image of NPD (A), LPD (B) and MD-LPD (C) seminiferous tubule morphology. Quantification of seminiferous tubule stage in NPD, LPD and MD-LPD testes (D). Mean seminiferous tubule cross section area (E), perimeter (F), lumen area (G) and area of the epithelium (H). Relative testicular expression of SRY sex determining region Y-box 9 (Sox9) (I), GATA binding protein 1(Gata1) (J), bromodomain, testis-specific (Brdt) (K), TATA-Box Binding Protein Associated Factor 2 (Taf2) (L), testis Expressed 101 (Tex101) (M) and IQ Motif Containing G (Iqcg) (n). Data are mean ± s.e.m. n = 8 males per dietary group with a minimum of 50 tubules per testis analysed in A–H. Data were analysed by one-way ANOVA followed by Bonferroni post-hoc test, or Kruskal–Wallis test with Dunns multiple comparison test where appropriate. *P < 0.05, **P < 0.01.

 This work is licensed under a