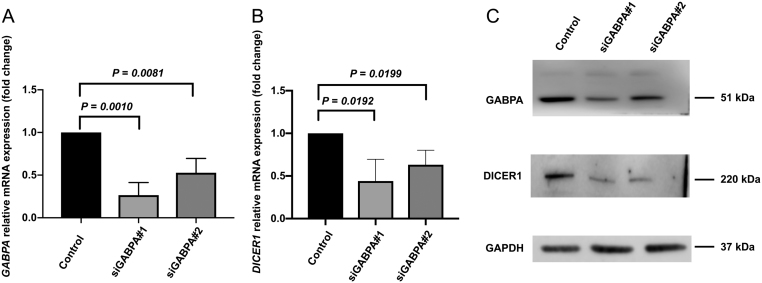
Figure 3.
GABPA knock down in FTC-238 cell line. (A) GABPA mRNA expression in the knock down cells (siGABPA#1 and siGABPA#2) is significantly reduced compared to control cells. (B) DICER1 mRNA expression in the knock down cells (siGABPA#1 and siGABPA#2) is significantly reduced compared to control cells. (C) Confirmation of reduced levels of GABPA and DICER1 after GABPA knock down. Estimated protein sizes are indicated to the right in kilodaltons (kDa). P values were calculated with Student’s t-test. Significant P values are in bold.

 This work is licensed under a