Figure 5.
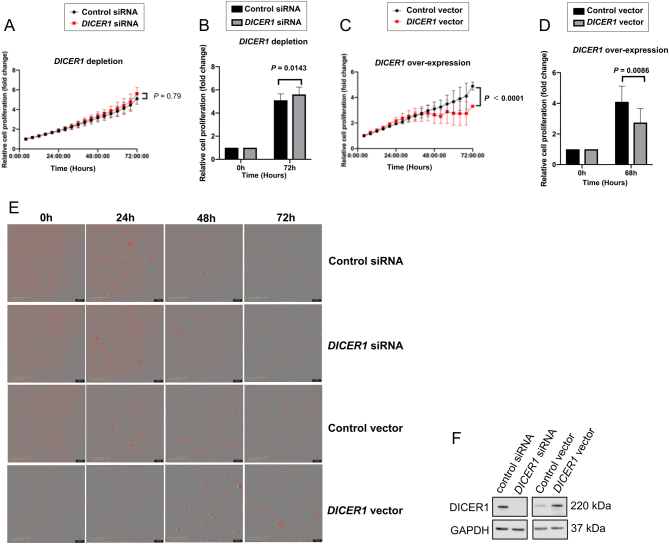
FTC-238 cell proliferation was assessed by monitoring alive cells in real time (Incucyte). Cell proliferation increased after DICER1 depletion using siDICER1#1 (A and B) and decreased in the DICER1 overexpression experiments (C and D). Difference in time and effect factors was analysed by two-way ANOVA. (B and D) Shows the relative increase and decrease in cell proliferation of FTC-238 cells at the starting and end points, respectively. Cell proliferation was calculated based on the cell number counting from three independent cell experiments, and relative cell proliferation was presented by comparing to cell numbers at the starting point. Date shown are the mean ± s.d. (n = 3). Images in E represent the FTC-238 cells growth pattern at different time points, where the red signal indicates the stained cell nuclei. As shown in F, DICER1 depletion and overexpression experiments were confirmed by Western blot. Estimated protein sizes are indicated to the right. A full colour version of this figure is available at https://doi.org/10.1530/ERC-19-0446.

 This work is licensed under a