Figure 7.
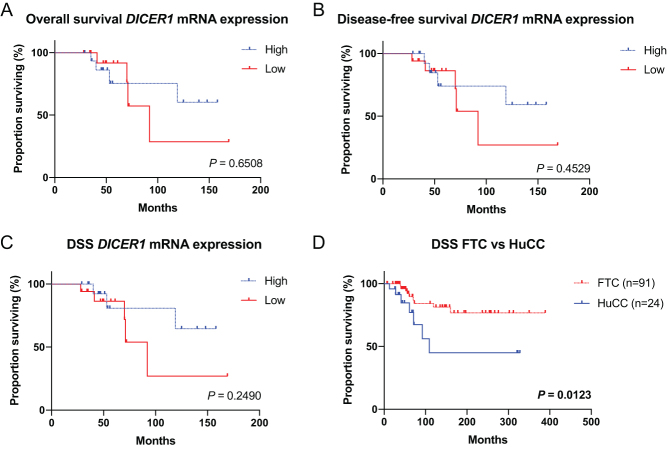
Kaplan–Meier survival curves in follicular thyroid carcinoma (FTC) and Hürthle cell carcinoma (HuCC) patients. (A) The overall survival in low vs high DICER1 expression. (B) The disease-free survival in low vs high DICER1 expression. (C) The disease-specific survival (DSS) in low vs high DICER1 expression. (D) DSS in FTC vs HuCC. P values were calculated using the Log-rank test. Significant P values are in bold. A full colour version of this figure is available at https://doi.org/10.1530/ERC-19-0446.

 This work is licensed under a