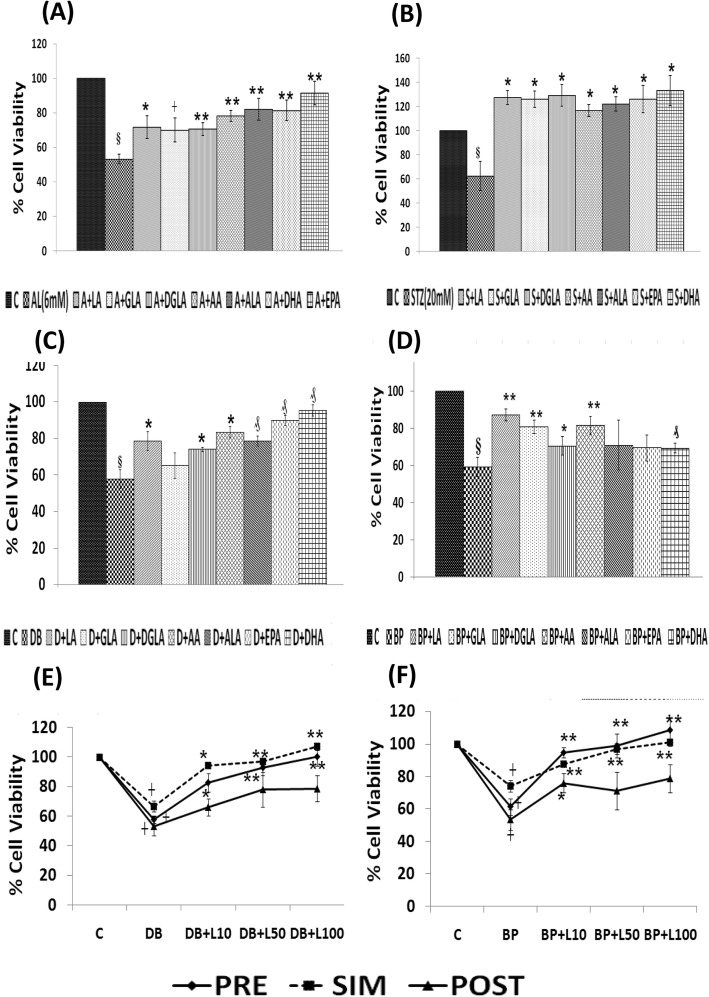
Fig. 2.
Effect of various n-3 and n-6 PUFAs treatment (pre- in case of AL/BP and simultaneous treatment in case of STZ/DB on chemical-induced cytotoxicity to RIN cells in vitro. a Effect of pre-treatment with different PUFAs (15 μg/ml) on AL (6 mM)-induced toxicity to RIN cells. All values expressed as mean ± SEM. § P < 0.001 vs untreated control, ┼ P ≤ 0.05, P < 0.02, **P < 0.001 vs alloxan-treated group. b Effect of simultaneous-treatment with different PUFAs (15 μg/ml) on STZ (20 mM)-induced toxicity to RIN cells. All values expressed as mean ± SEM. § P < 0.001 vs untreated control, *P < 0.001 vs STZ-treated group. c Effect of simultaneous-treatment with different PUFAs (15 μg/ml) on DB (100 ng/ml)-induced toxicity to RIN cells. All values expressed as mean ± SEM. § P < 0.001 vs untreated control, *P < 0.001; ₰P ≤ 0.01 vs DB-treated group. d Effect of pre-treatment with different PUFAs (15 μg/ml) on BP (1.5 mM)-induced toxicity to RIN cells. All values expressed as mean ± SEM. § P < 0.001 vs untreated control, ┼ P ≤ 0.05, *P < 0.02, ₰ P ≤ 0.01, **P < 0.001 vs BP treated group (LA, linoleic acid; GLA, γ-linolenic acid; DGLA, dihomo- γ-linolenic acid; AA, arachidonic acid; ALA, α-linolenic acid; EPA, eicosapentaenoic acid; DHA, docosahexaenoic acid). e Effect of simultaneous -treatment with lipoxin A4 (L) on DB (100 ng/ml)-induced toxicity to RIN cells. All values expressed as mean ± SEM. ┼ P ≤ 0.001 vs untreated control, *P < 0.01; **P < 0.001 vs DB treated group. f Effect of pre -treatment with lipoxin A4 (L) on BP (1.5 mM)-induced toxicity to RIN cells. All values expressed as mean ± SEM. ┼ P ≤ 0.001 vs untreated control, **P < 0.001 vs BP treated group. All the above set of experiments were done in triplicate on three separate occasions (n = 9) and all values expressed as mean ± SEM

