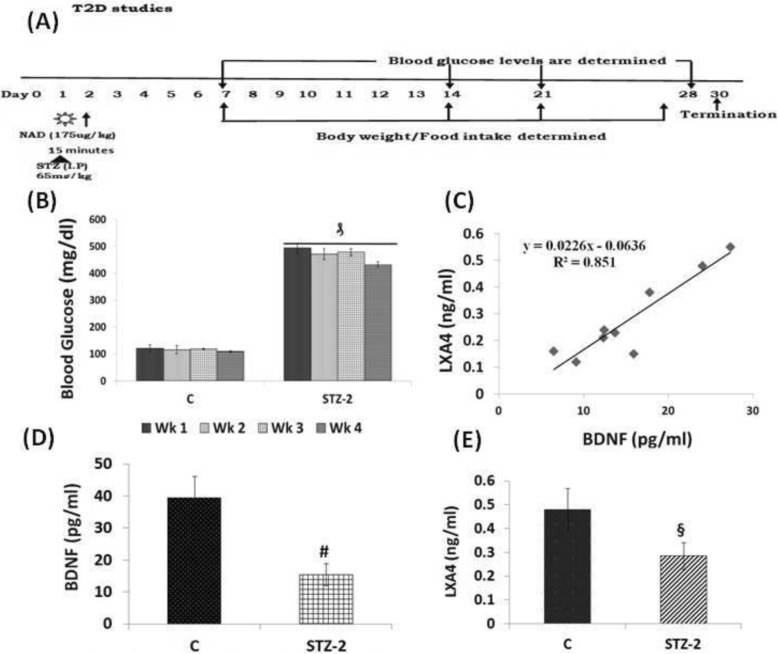
Fig. 9.
a STZ-induced type 2 diabetes protocol. Animals were housed for 1 week for acclimatization after which single I.P injection of STZ was given and blood glucose levels were estimated once in 10 days till the end of the study. b Blood glucose levels were measured once in 7 days until the end of the study. ₰P < 0.001 vs control group. c Correlation analysis of levels of BDNF and LXA4 in the plasma of STZ treated and control animals (n = 8) regression coefficient R = 0.851. d Plasma LXA4 levels (ng/ml) in STZ-induced type 2 diabetes mellitus Wistar rats on day 30 of the study. All values expressed as mean ± SEM. § P < 0.001 vs untreated control group of animals. e Plasma BDNF levels (pg/ml) in STZ-induced type 2 diabetes mellitus Wistar rats on day 30 of the study. All values expressed as mean ± SEM. # P < 0.001 vs untreated control

