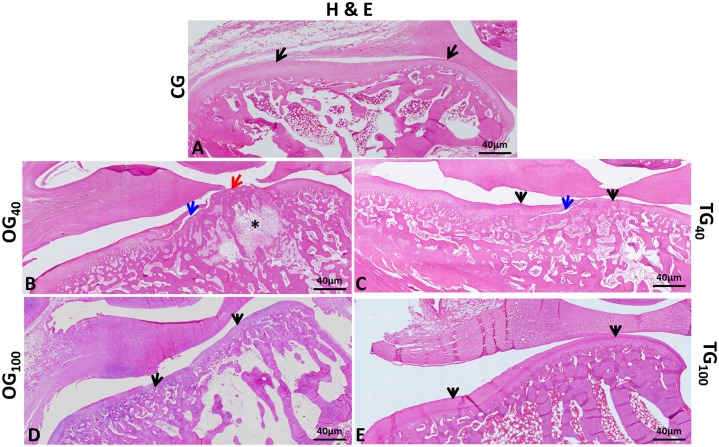
Fig 4. Histologic appearance of the mandibular condyle surface.
(A) Control group—TMJ showing normal tissue structures and anatomically normal condyle; characteristic convexity in the anterior region; normal cartilage layer (arrows); intact articular disc. (B and D) OG40 and OG100—TMJ showing anatomic changes caused by OA. Condylar flattening and deformation; decreased cartilage thickness (black arrows); loss of cartilage matrix (red arrow); crack reaching the subchondral bone tissue (blue arrow); subchondral irregularities; degeneration of bone trabeculae with intra-articular cyst formation (*); tear of the articular disc. (C) TG40—Decreased cartilage thickness (black arrows); presence of substantial crack starting at the articular surface and extending in depth (blue arrow); articular disc constricted in the middle. (E) TG100—Tissues with normal appearance; anatomically normal articular condyle; typical condylar convexity in the anterior region; cartilage layer without changes (arrows); intact articular disc. (TMJ: temporomandibular joint, OA: osteoarthritis, OG40: osteoarthritis group at 40 days, OG100: osteoarthritis group at 100 days, TG40: treatment group at 40 days, TG100: treatment group at 100 days).

