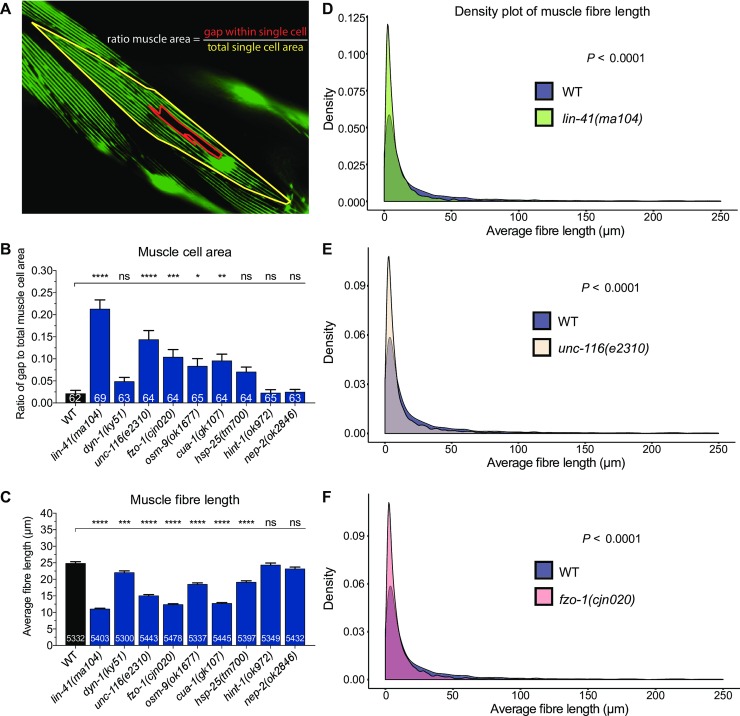
Fig 5. Quantification of body wall muscle area and fibre length in 3-day old adults.
(A) Example image of how the muscle area ratio (gap to total cell area) was calculated. Gaps left by degenerating muscle fibres (red-lined area) and the total area of a single muscle cell (yellow-lined area) were drawn and calculated in Fiji using the polygon selection tool. (B) Comparison of gap to total muscle cell area ratio between WT and CMT2 mutants. (C) Measurement of individual fibre length using a combination of Fiji skeletonization and ilastik segmentation. The protocol is illustrated in S4 Fig. Only images with at least one complete visible oblique muscle cell were included for analysis. Fibres that recorded 0 µm or longer than 250 µm were excluded. (D-F) Density plot of muscle fibre length compared between WT and lin-41(ma104), unc-116(e2310), and fzo-1(cjn020). Density plots of other CMT2 mutants can be found in S5 Fig. Bar represents mean ± S.E.M in (B) and (C). Number of animals and fibres analyzed is listed in each bar in (B) and (C), respectively. *P < 0.05, **P < 0.01, ***P < 0.001, ****P < 0.0001, ns = not significant from one-way ANOVA with Dunnett’s post hoc tests for multiple comparison in (B) and (C). F test was used for variance comparison between WT and mutants in (D) to (F), with significance set at P < 0.05. All animals expressed the stEx30 transgene.

