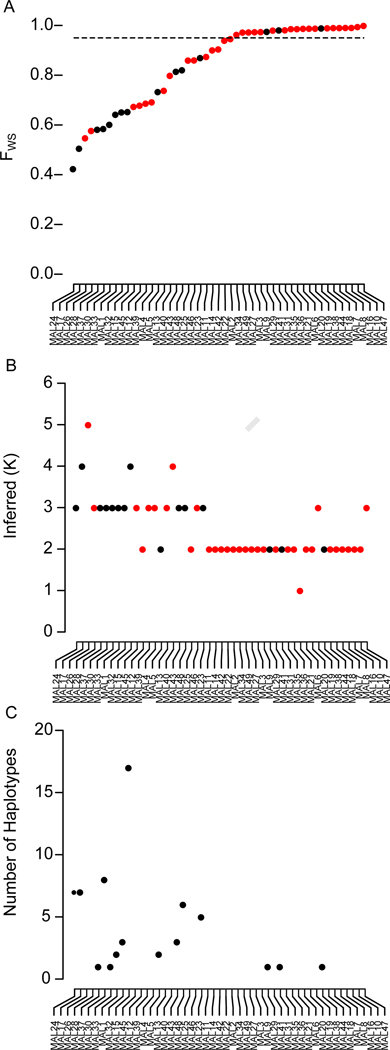
Figure 2. Complexity of infection inferred from bulk and single-cell sequencing.
(A) FWS scores for 49 bulk sequenced infections. Infections above the dashed line (FWS=0.95) are assumed to be clonal. (B) Inferred number of haplotypes (K) inferred by DEploid, infections are ordered by the FWS score. Black dots in (A) and (B) denote infections also deconvoluted by single-cell sequencing. (C) Number of unique haplotypes inferred by single-cell sequencing. This data is included in Table S1.

