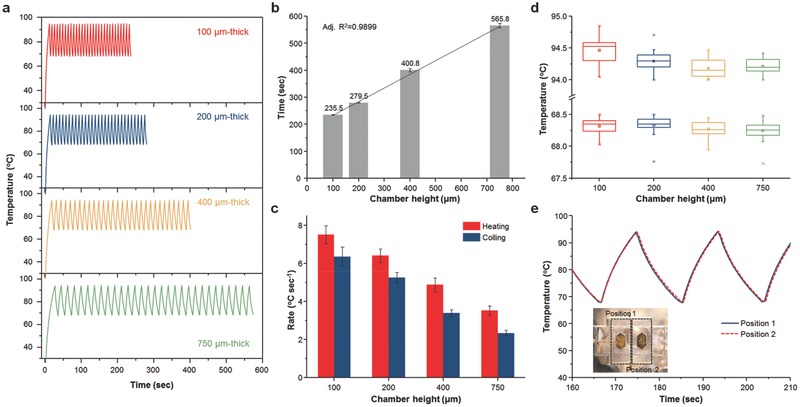
Figure 3.

LED‐driven thermal cycling of cavity PCR. a) Representative temperature profiles of 30 optical cavity PCR thermal cycles with different chamber heights. For each height, 30 cycles from 94 °C (denaturation) to 68 °C (annealing/extension) were run. b) Time for 30 PCR thermal cycles with different chamber heights. c) Heating and cooling rates as a function of the cavity PCR chamber height. An increase in the chamber height increases the cycle time and decreases the heating/cooling rates. d) Measured temperature distribution at 94 °C (denaturation) and 68 °C (annealing/extension) during 30 thermal cycles with different chamber heights. e) Comparison of temperature profiles during thermal cycling between position 1 (reference chamber) and position 2 (cavity PCR chamber) to ensure that both chambers are heated at the same rate. The inset displays a photograph of the PCR chamber holder, showing positions 1 and 2.
