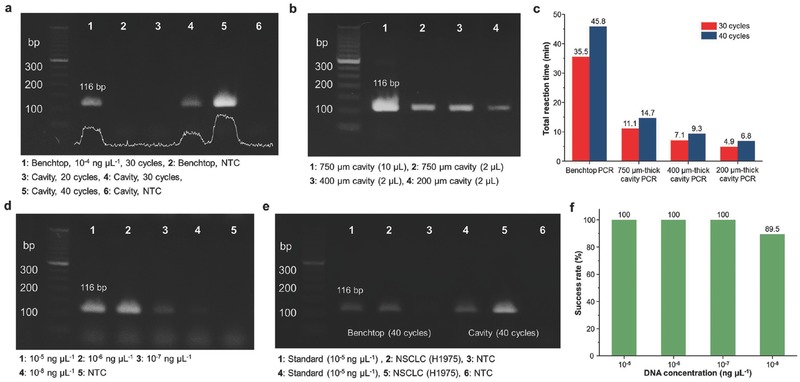
Figure 4.

Nucleic acid amplification using cavity PCR. a) Results from 2% agarose gel demonstrating a clear trend of increased PCR byproduct with an increase in PCR cycle numbers. b) Image of 2% agarose gel with different heights of cavity PCR chamber. For the comparison, the same volume (2 μL) of PCR byproduct was used for gel electrophoresis. c) Summary of total amplification time for the benchtop and cavity PCR. The reaction time for the benchtop is based on the cycling protocol recommended by the manufacturer. A 70%–85% reduction in total reaction time can be achieved. d) Results from 2% agarose gel demonstrating a trend in band intensity with different concentrations of initial c‐MET cDNA. The lowest concentration of template DNA is 10−8 ng μL−1 (two copies per μL). e) Results from 2% agarose gel showing the amplification of c‐MET cDNA prepared from NSCLC cell for the heterogeneous biological sample. (Standard: c‐MET cDNA purchased from Sino Biological Inc.) f) Success rate (%) of the cavity PCR with different concentrations of c‐MET cDNA (n = 7 for 10−5, 10−6, 10−7 ng μL−1, n = 19 for 10−8 ng μL−1).
