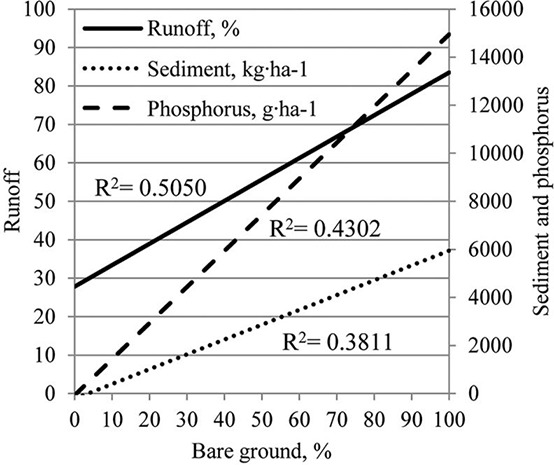
Figure 3.

Correlation between the percentage of applied precipitation, sediment, and phosphorus loading in runoff versus the percentage of bare ground during rainfall simulations conducted in June, August, and October 2008 and April 2009 and in June, August, and October 2009 and April 2010.
