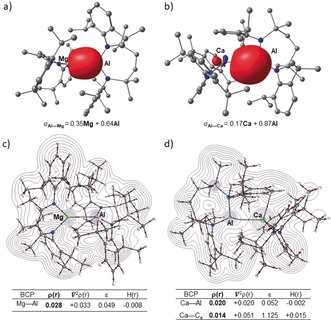
Figure 4.

Localized Pipek–Mezey orbitals of a) 15 and b) 16 showing Al−Ca and Al−Mg σ‐bonding orbitals, respectively. QTAIM molecular graphs of c) 15 and d) 16. The electron density contours are computed in the {Mg/Al/Si} planes with bond critical points (BCPs) shown as small red spheres. BCP electron densities (ρ(r) in e Å−3), values of the Laplacian of the electron density (∇2 ρ(r) in e Å−5), ellipticities (ϵ) and total energy densities (H(r) in a.u.) are tabulated beneath the relevant figures.
