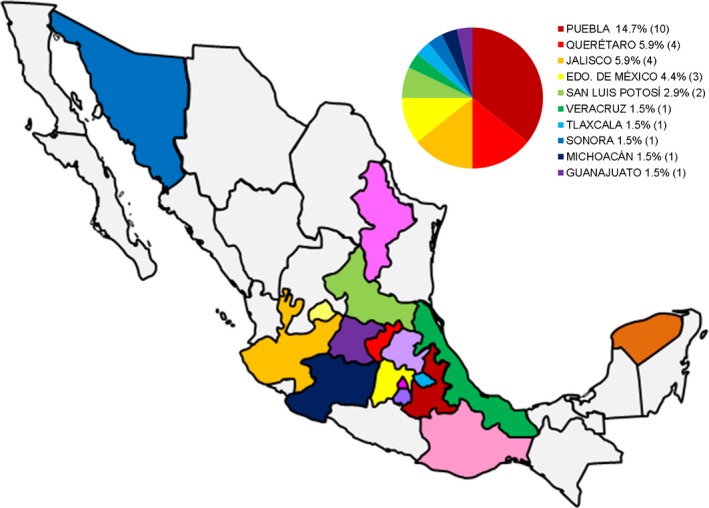
Figure 1.

Sampled states in Mexico. All sampled states are shown on the map in different colours. The chart shows those states where positive samples were collected, as revealed by endpoint RT‐PCR targeting the PEDv S gene [Colour figure can be viewed at http://wileyonlinelibrary.com]
