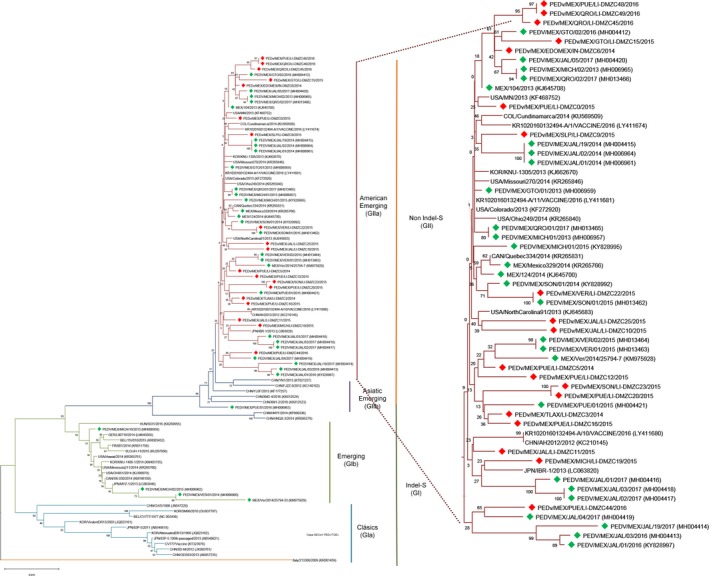
Figure 2.

Phylogenetic analysis of the complete sequence of the S gene, along with reference strains. The strains herein reported are marked in red, while previously described Mexican strains are marked in green. The tree was built with the neighbor‐joining method, using the maximum likelihood for nucleotide distance and 1,000 bootstrap replications, with MEGA7 [Colour figure can be viewed at http://wileyonlinelibrary.com]
