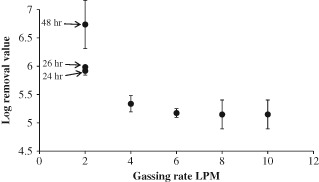
Figure 3.

T4 phage removal in a SAMBR at different gassing rates, for the 2 LPM data the time since the gassing rate was set is displayed next to the data point. For all other data points the time did not affect the LRV, and samples were taken at 24, 26 and 28 h and averaged.
