
Figure 1.
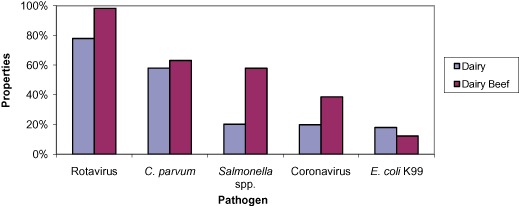
Percentage of properties in each state with at least one positive sample for each of the enteropathogens.
Official websites use .gov
A
.gov website belongs to an official
government organization in the United States.
Secure .gov websites use HTTPS
A lock (
) or https:// means you've safely
connected to the .gov website. Share sensitive
information only on official, secure websites.
Percentage of properties in each state with at least one positive sample for each of the enteropathogens.