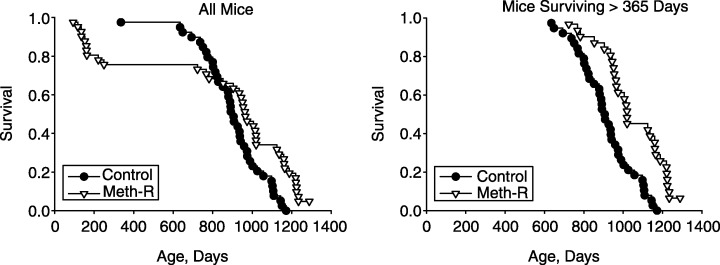
Figure 1.

Survival curves for control and methionine‐restricted (Meth‐R) groups. Each symbol represents one mouse dying at the age indicated. The left panel shows all mice and the right panel shows only those mice that survived at least 365 days. At the time of writing, there are 2/40 survivors in the Meth‐R group, and 0/40 survivors in the control group.
