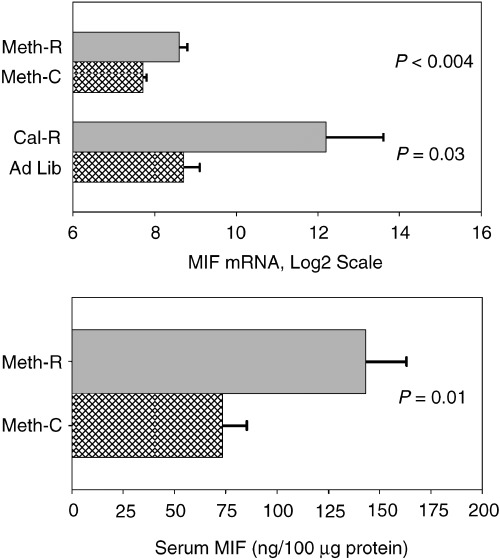
Figure 3.

Levels of MIF mRNA in liver cell lysates (upper panel) of Meth‐R, CR and their respective controls, and (lower panel) of serum MIF protein concentrations in Meth‐R and control mice. Bars show mean levels ± SEM; mRNA is in arbitrary units. There were seven or eight mice per group for the Meth‐R samples and four mice per group for the CR samples. Significance tests for the serum protein used the Student's t‐test, and the Mann–Whitney test was used (with log2‐transformed values) for the mRNA comparisons.
