Figure 1.

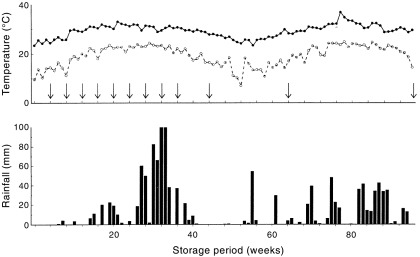
Weekly mean maximum and minimum temperatures and rainfall during the experiment. The arrows indicate when seed samples were retrieved and tested.

Weekly mean maximum and minimum temperatures and rainfall during the experiment. The arrows indicate when seed samples were retrieved and tested.