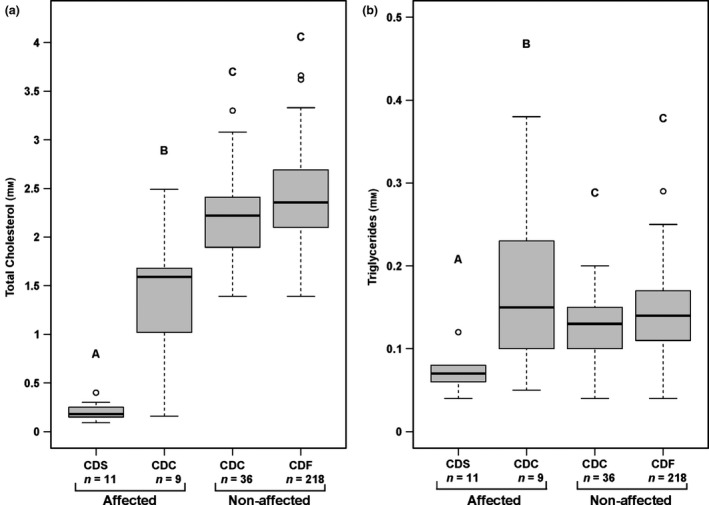
Figure 1.

Boxplots showing (a) total blood cholesterol and (b) triglyceride concentrations in clinically CD affected and non‐affected Holstein cattle. APOB genotypes are shown as wild‐type (CDF), heterozygous mutant (CDC) and homozygous mutant (CDS). The number of animals per group are shown below the boxplots (11 CDS affected and nine CDC affected; 36 CDC non‐affected and 218 CDC non‐affected). Different capital letters above the box plots indicate significant differences between the groups (P < 0.025).
